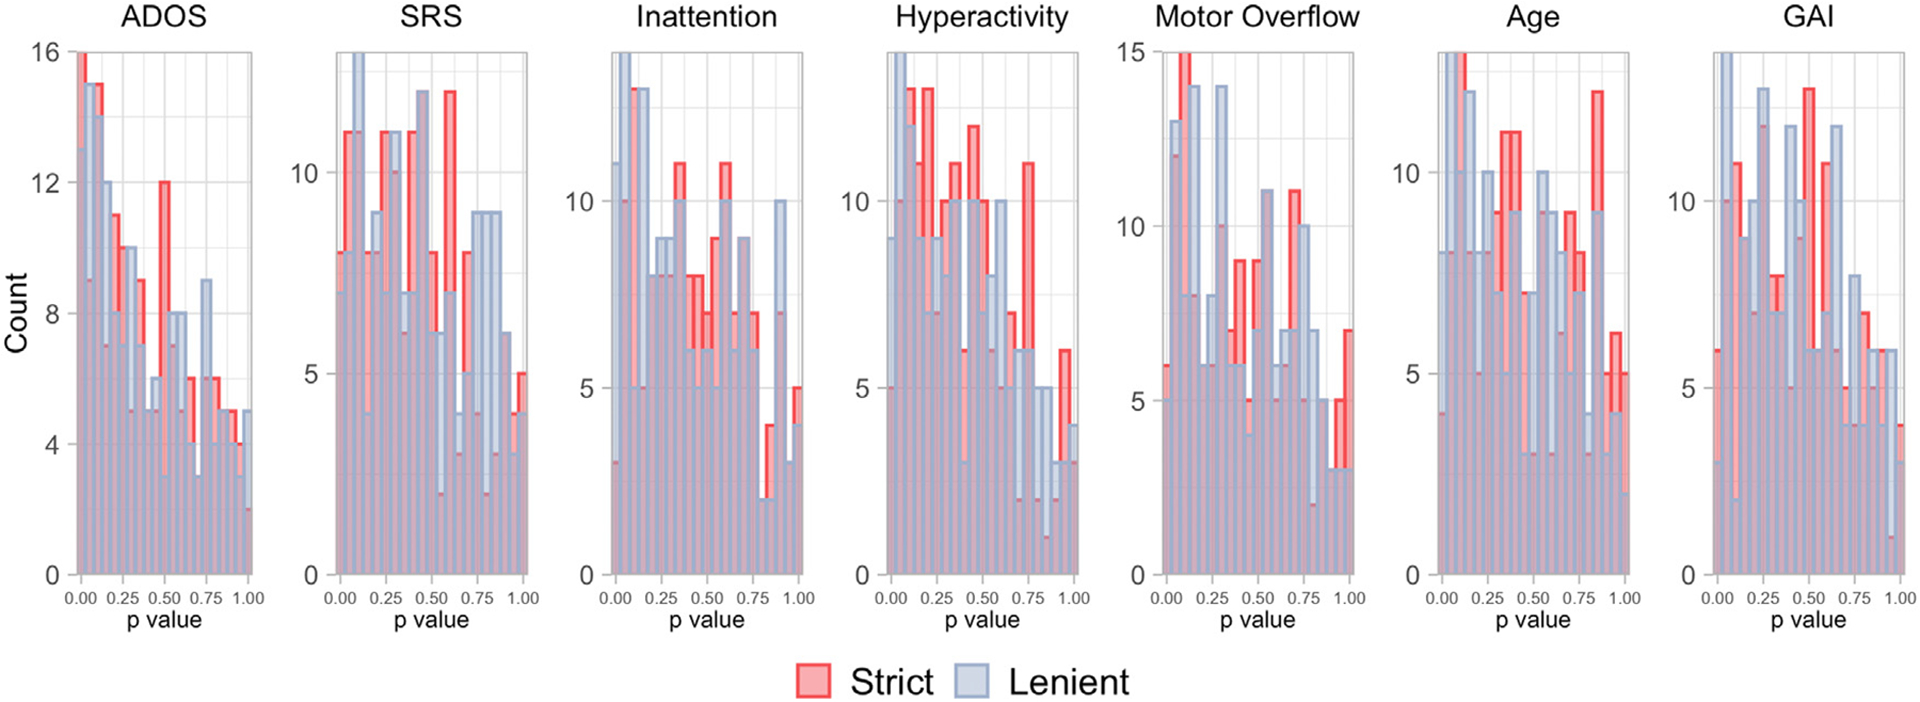
Fig. 6. Some covariates related to rs-fMRI exclusion probability are also related to functional connectivity.

Histograms of p values for generalized additive models of the relationship between edgewise functional connectivity in participants with usable rs-fMRI data and (from left to right) ADOS, social responsiveness scale (SRS) scores, inattentive symptoms, hyperactive/impulsive symptoms, total motor overflow as assessed during the Physical and Neurological Exam for Subtle Signs, age, and general ability index (GAI). For a given covariate, a clustering of p values near zero suggests that covariate is associated with functional connectivity for a greater number of edges. Several covariates appear to be related to functional connectivity using both the lenient motion quality control (slate blue bins) and the strict motion quality control (red bins).
