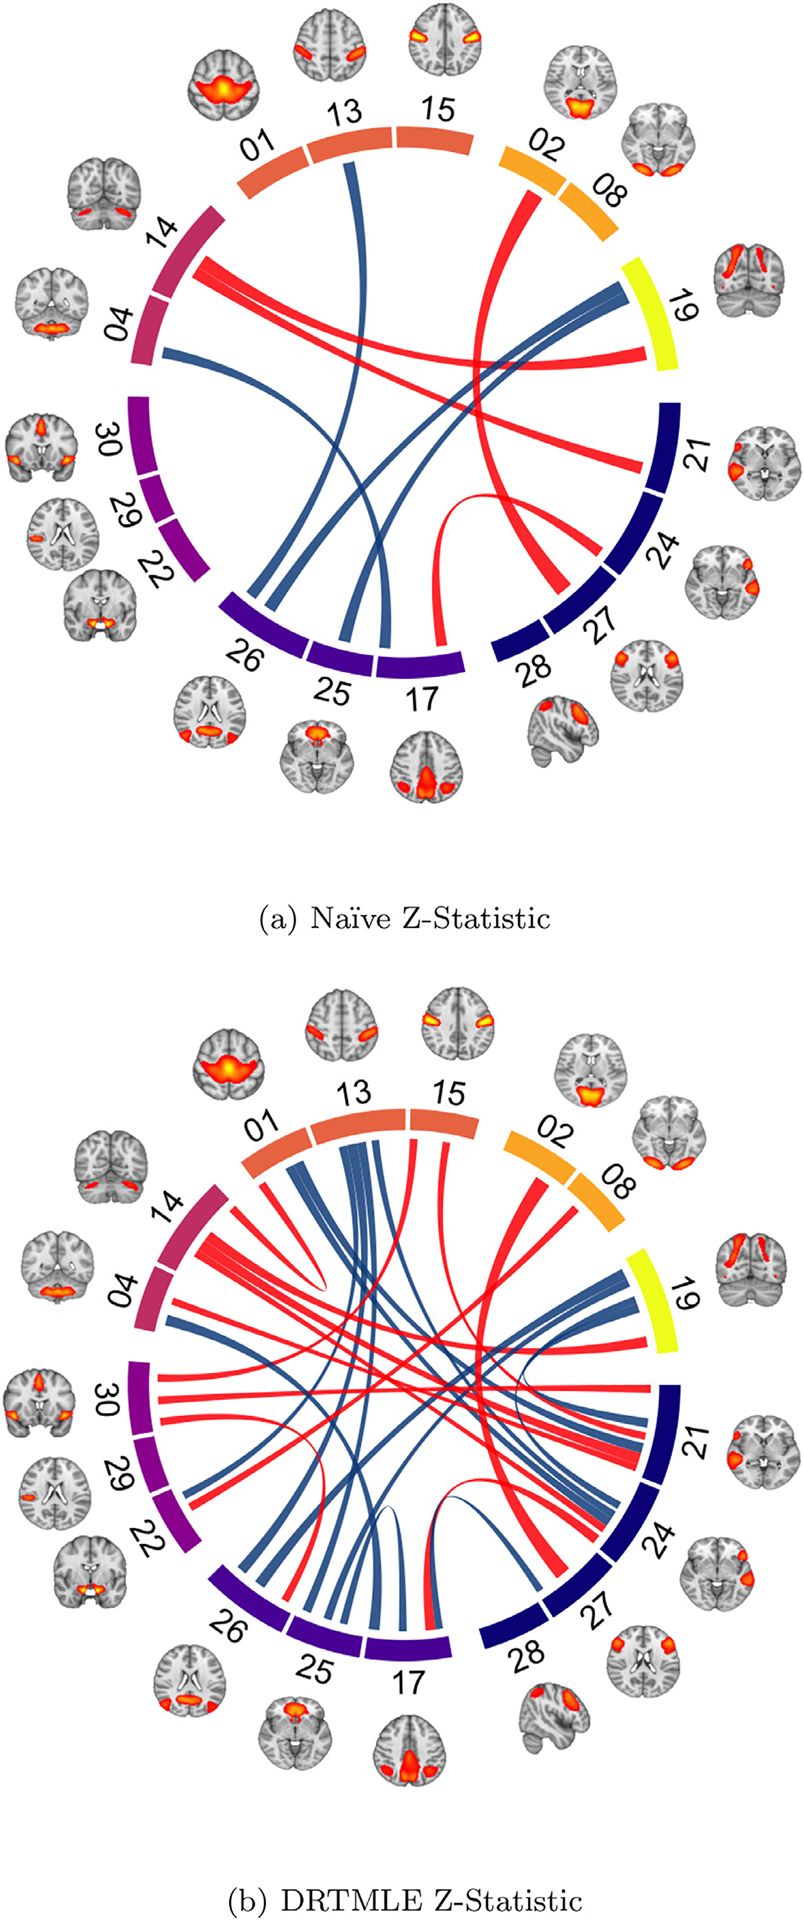
Fig. 7. The DRTMLE deconfounded group difference revealed more extensive differences than the naïve approach.

Z-statistics for ASD versus TD using a) the naïve test and b) using DRTMLE. Connections are thresholded using a false discovery rate (FDR) of 0.20. Blue lines indicate ASD > TD (4 in naïve, 13 in DRTMLE). Red lines indicate ASD < TD (4 in naïve, 12 in DRTMLE). Brain regions contributing to each independent component are illustrated and components are grouped by functional assignment. Navy nodes: control. Blue violet: default mode. Purple: salience/ventral attention. Magenta: pontomedullary/cerebellar. Coral: somatomotor. Orange: visual. Yellow: dorsal attention. FDR=0.05 is plotted in Web Supplement Fig. S3. See Web Supplement Fig. S4 for a visualization of the naïve and deconfounded means and individual-level partial correlations. These plots were generated using the circlize package in R (Gu et al., 2014) and the tutorial provided by Mowinckel (2018).
