
Figure 1.
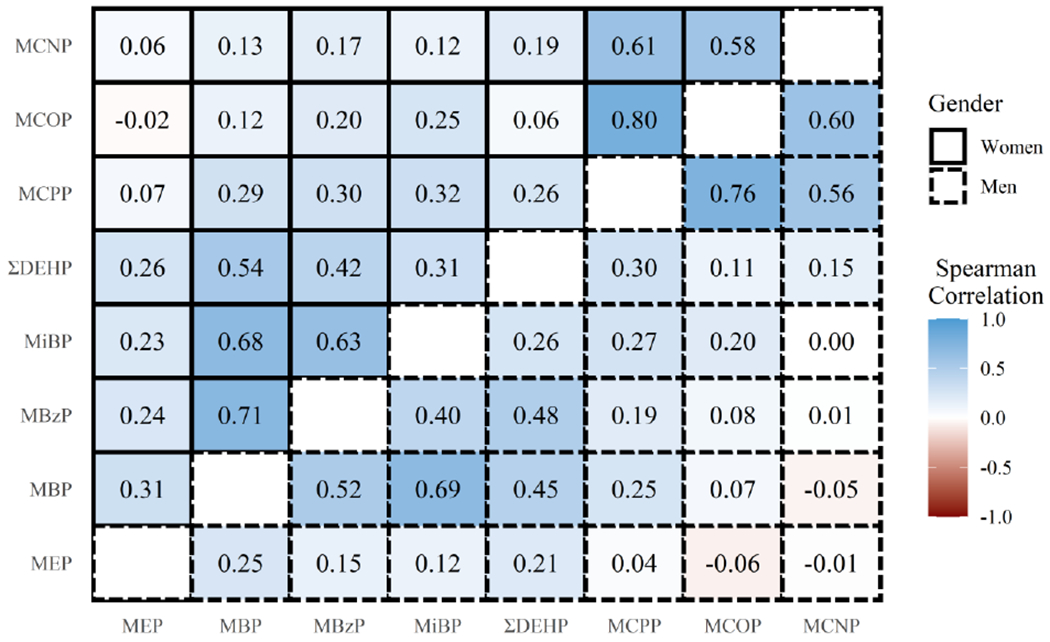
Spearman correlation matrix of specific gravity-corrected urinary phthalate metabolite concentrations for EARTH study participants by gender at first cycle. Upper and lower triangles of the matrix correspond to phthalate metabolite correlations for women and men, respectively.