
Figure 3.
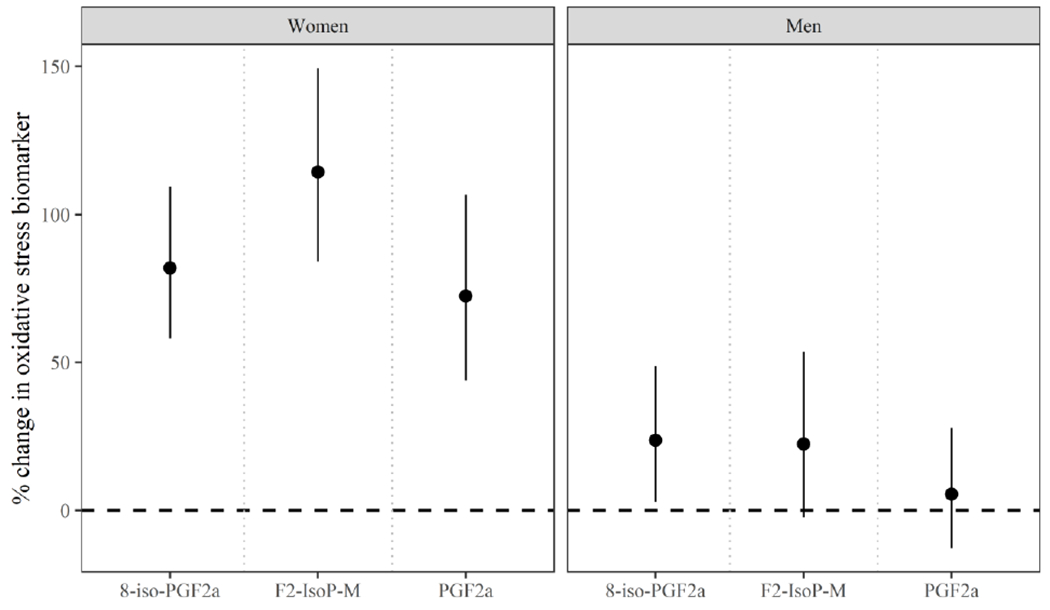
Adjusteda percent change (95% credible interval) in oxidative stress biomarker concentration per joint increase in all urinary phthalate metabolite concentrations from the 25th to 75th percentile by gender.
aModels include the following covariates: education (±college graduate), race (White/Other), smoking status (ever/never), infertility diagnosis (male/female factor/unexplained), age (years), body mass index (kg/m2), current cycle fertility treatment procedure (IVF/IUI), and current cycle urine specific gravity.