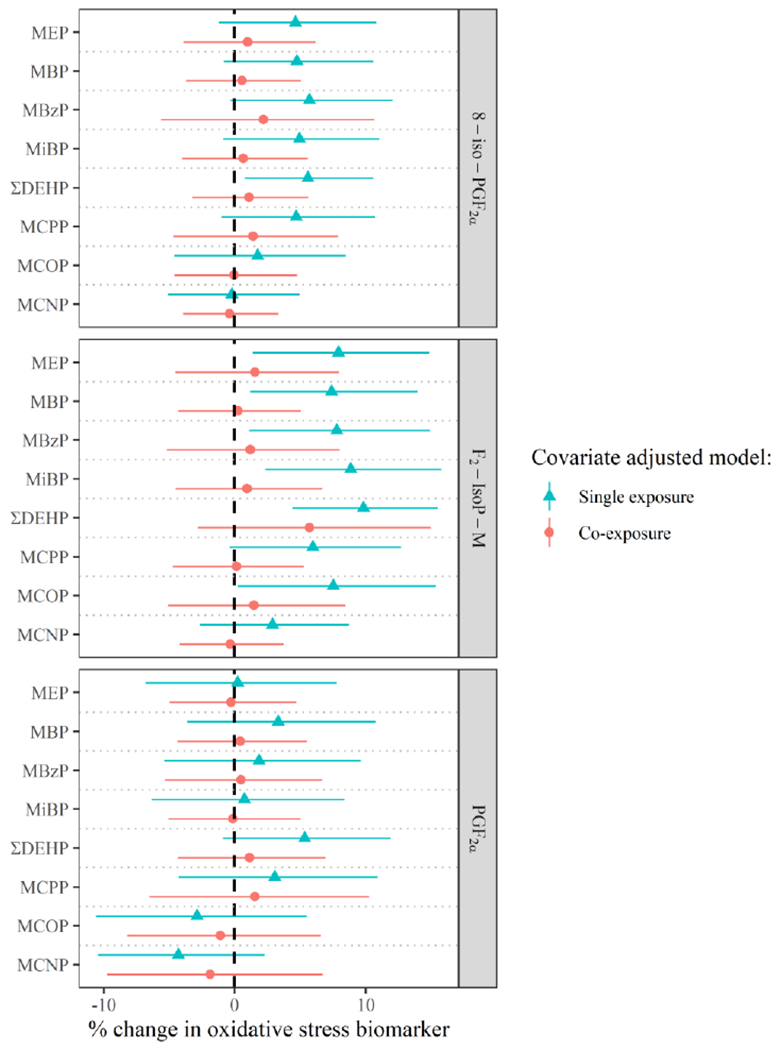
Figure 4.

Adjusteda percent change (95% Confidence Interval for single exposure models, 95% Credible Interval for co-exposure models) in oxidative stress biomarker concentration per interquartile range difference in urinary phthalate metabolite concentration, in longitudinal models adjusted for demographic covariates (green triangles) and additionally jointly adjusted for all other phthalate metabolites (red circles).
aSingle exposure and co-exposure models include the following covariates: education (±college graduate), race (white/other), smoking status (ever/never), infertility diagnosis (male/female factor/unexplained), age (years), body mass index (kg/m2), current cycle fertility treatment procedure (IVF/IUI), urine specific gravity at treatment, and urine specific gravity during the follicular phase. Co-exposure models were estimated using Bayesian Kernel Machine regression with all exposures included, and estimates display the percent change for an increase in a specific phthalate metabolite from the 25th percentile to the 75th percentile while holding all other phthalate metabolites in the mixture fixed at their respective 50th percentiles.
