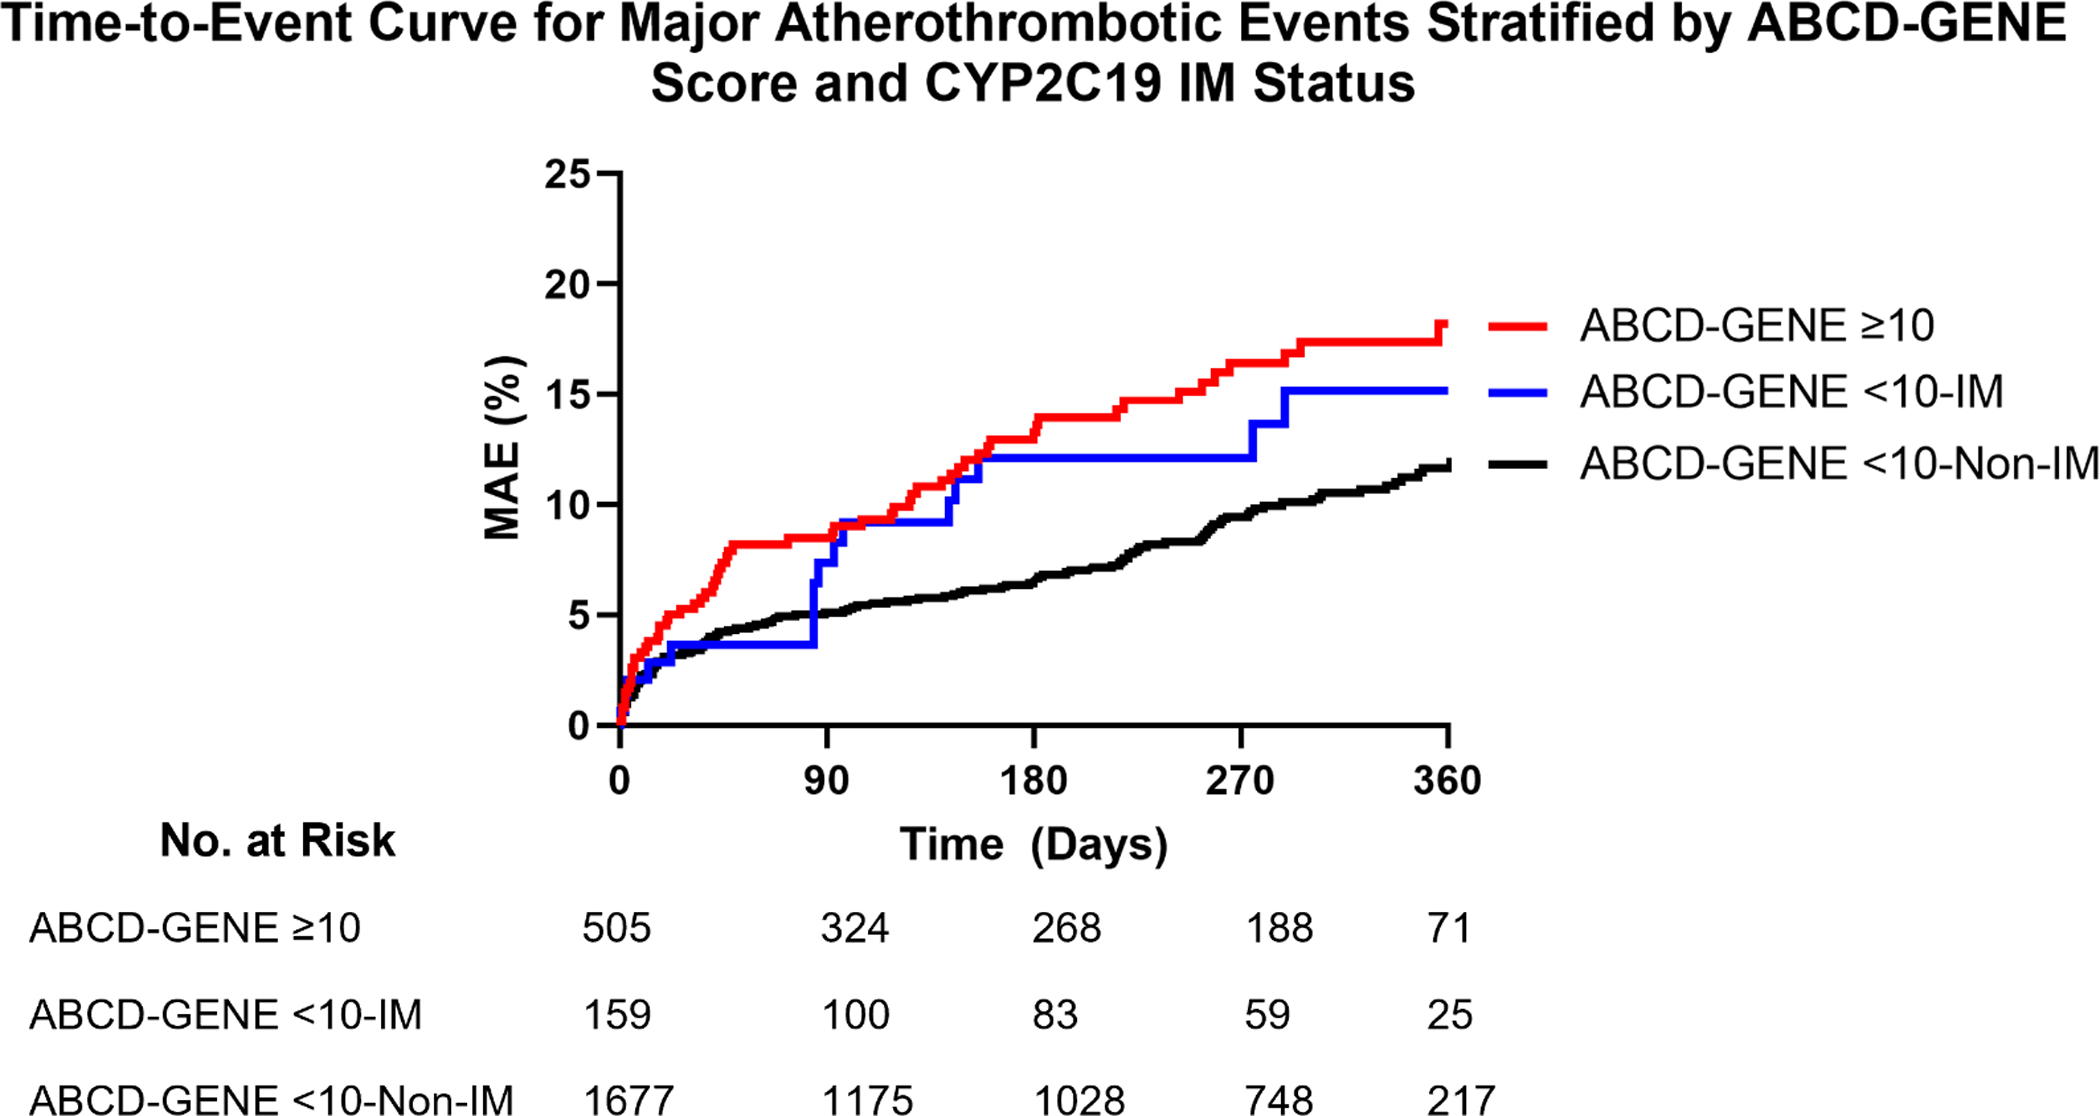
Figure 2. Time-to-Event Curve for Major Atherothrombotic Events Stratified by ABCD-GENE Score and CYP2C19 IM Status.

Major atherothrombotic events (MAE), defined as the first occurrence of death, myocardial infarction, ischemic stroke, stent thrombosis, or unstable angina requiring revascularization at 1-year post-PCI. Adjusted hazard ratio (HR) for ABCD-GENE score <10-Non-IM versus ≥10 = 0.58 (95% CI, 0.43–0.79), p<0.001. Adjusted HR for ABCD-GENE score <10-IM versus ≥10 = 1.03 (95% CI, 0.59–1.81), p=0.917. IM: CYP2C19 intermediate metabolizer. The tails of the Kaplan-Meier curve were truncated at 360 days post-PCI, after which time less than 10% of each stratum were available for follow-up. In the ABCD-GENE <10-Non-IM group, n=4 events were observed after day 360, when only 64 patients (4%) were still in follow-up. No MAE occurred after day 360 for the ABCD-GENE score ≥10 or score <10-IM groups when 16 (3%) and 7 (4%) patients were available for follow-up, respectively.
