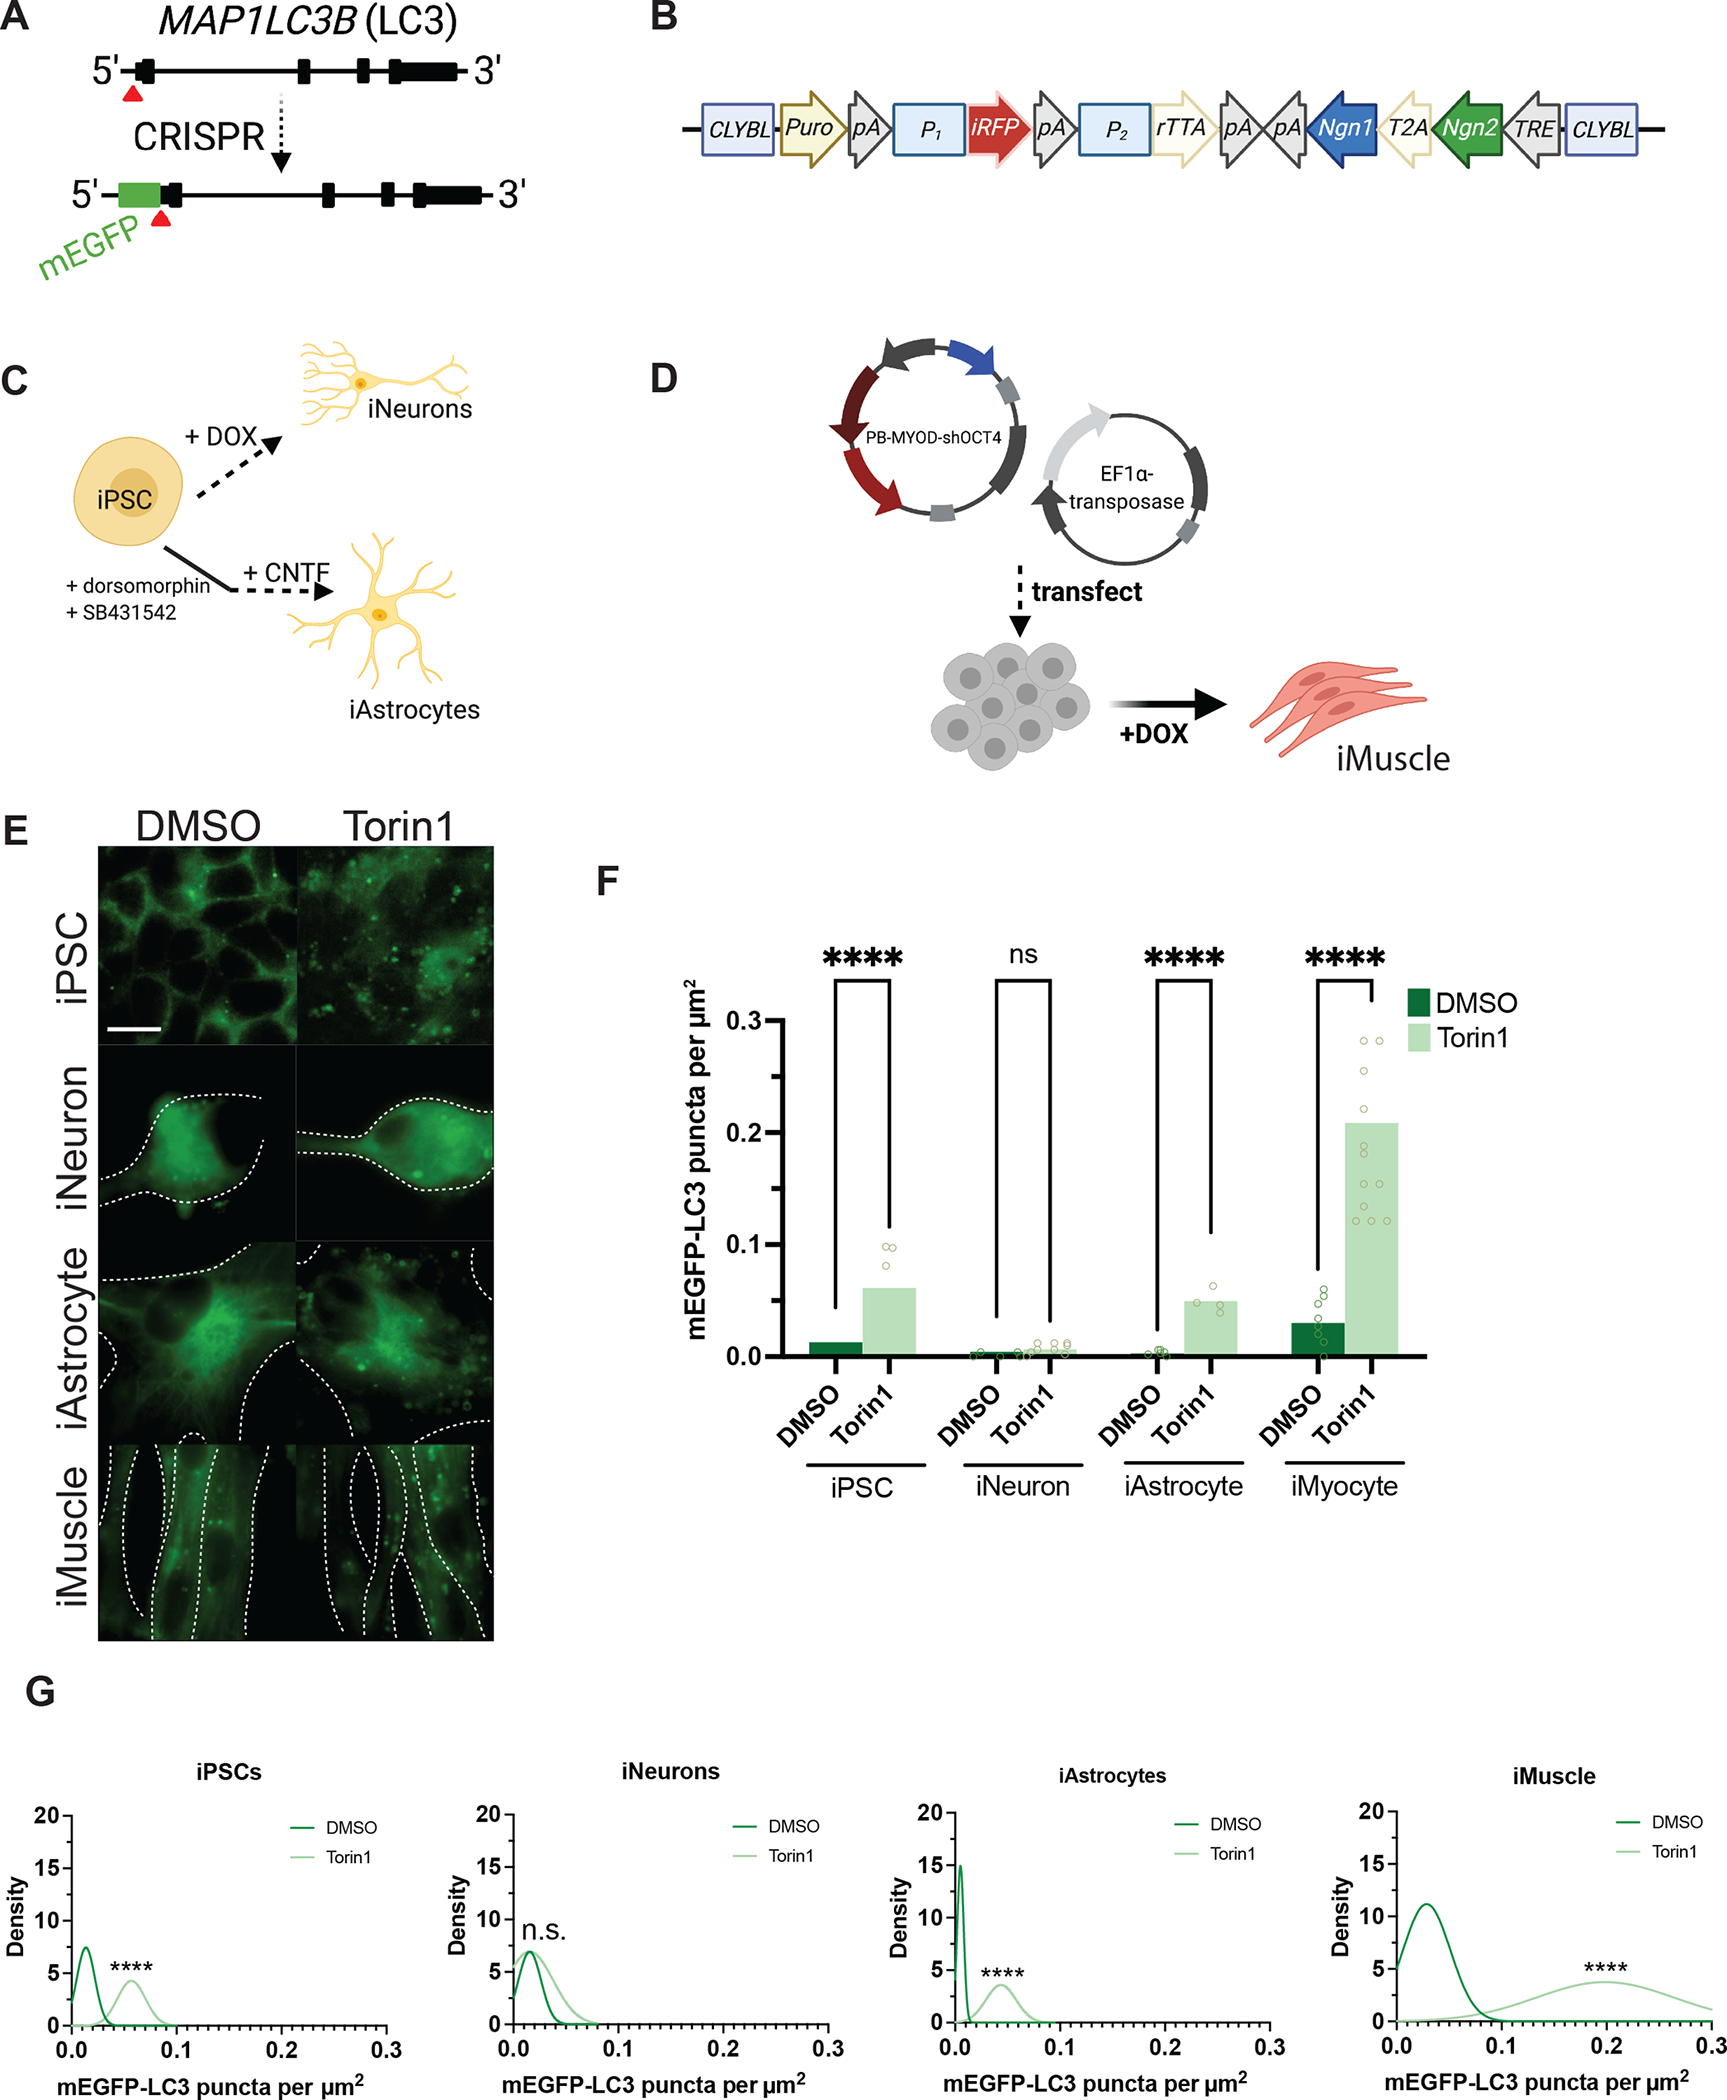
Figure 1. Neurons are resistant to Torin1-mediated induction of autophagy.

(A) Targeting strategy using CRISPR/Cas9 to knock-in mEGFP immediately 5’ to exon1 in the MAP1LC3B gene. (B) Schematic of the cassette used to integrate NGN1 and NGN2 at the CLYBL safe harbor locus under the control of a Tet-ON system. Puro, puromycin-resistance gene; pA, poly-A tail; P1, P2, promotors; iRFP, near-infrared fluorescent protein; rTTA, reverse tetracycline-controlled transactivator; NGN1 and NGN2, neurogenin-1 and -2; T2A, self-cleaving peptide; TRE, tetracycline response element. (C) Protocols used to differentiate iPSCs into iNeurons using doxycycline-mediated, forced expression of differentiation factors, or into iAstrocytes using dual-SMAD inhibition followed by terminal differentiation by culturing in CNTF. (D) Protocol for differentiating iPSCs into iMuscle using a piggybac/transposase system to integrate doxycycline-inducible MYOD and OCT4 shRNA. (E) Representative 100X images of mEGFP-LC3-positive vesicles in the cell types indicated after treatment with DMSO vehicle or 250nM Torin1 for 4h. Dotted lines indicate cell borders, within which cell area in μm2 was calculated using Fiji. (F) Scatterplots of blinded manual quantifications of mEGFP-LC3-positive vesicles imaged as in (E), normalized to cell area in μm2. Data are from three independent experiments. n.s., not significant; *p<0.05; ****p<0.0001; one-way ANOVA with Šídák’s multiple comparisons test. (G) Density plots of data from (F), which visualize the distribution of quantification data over a continuous interval with kernel smoothing to reduce noise and facilitate visualization of the distribution shape of data and peaks in which data are concentrated. n.s., not significant; ****p<0.0001, two-sample Kolmogorov-Smirnov test. See also Figure S1, Figure S2, Figure S5, and the STAR Methods.
