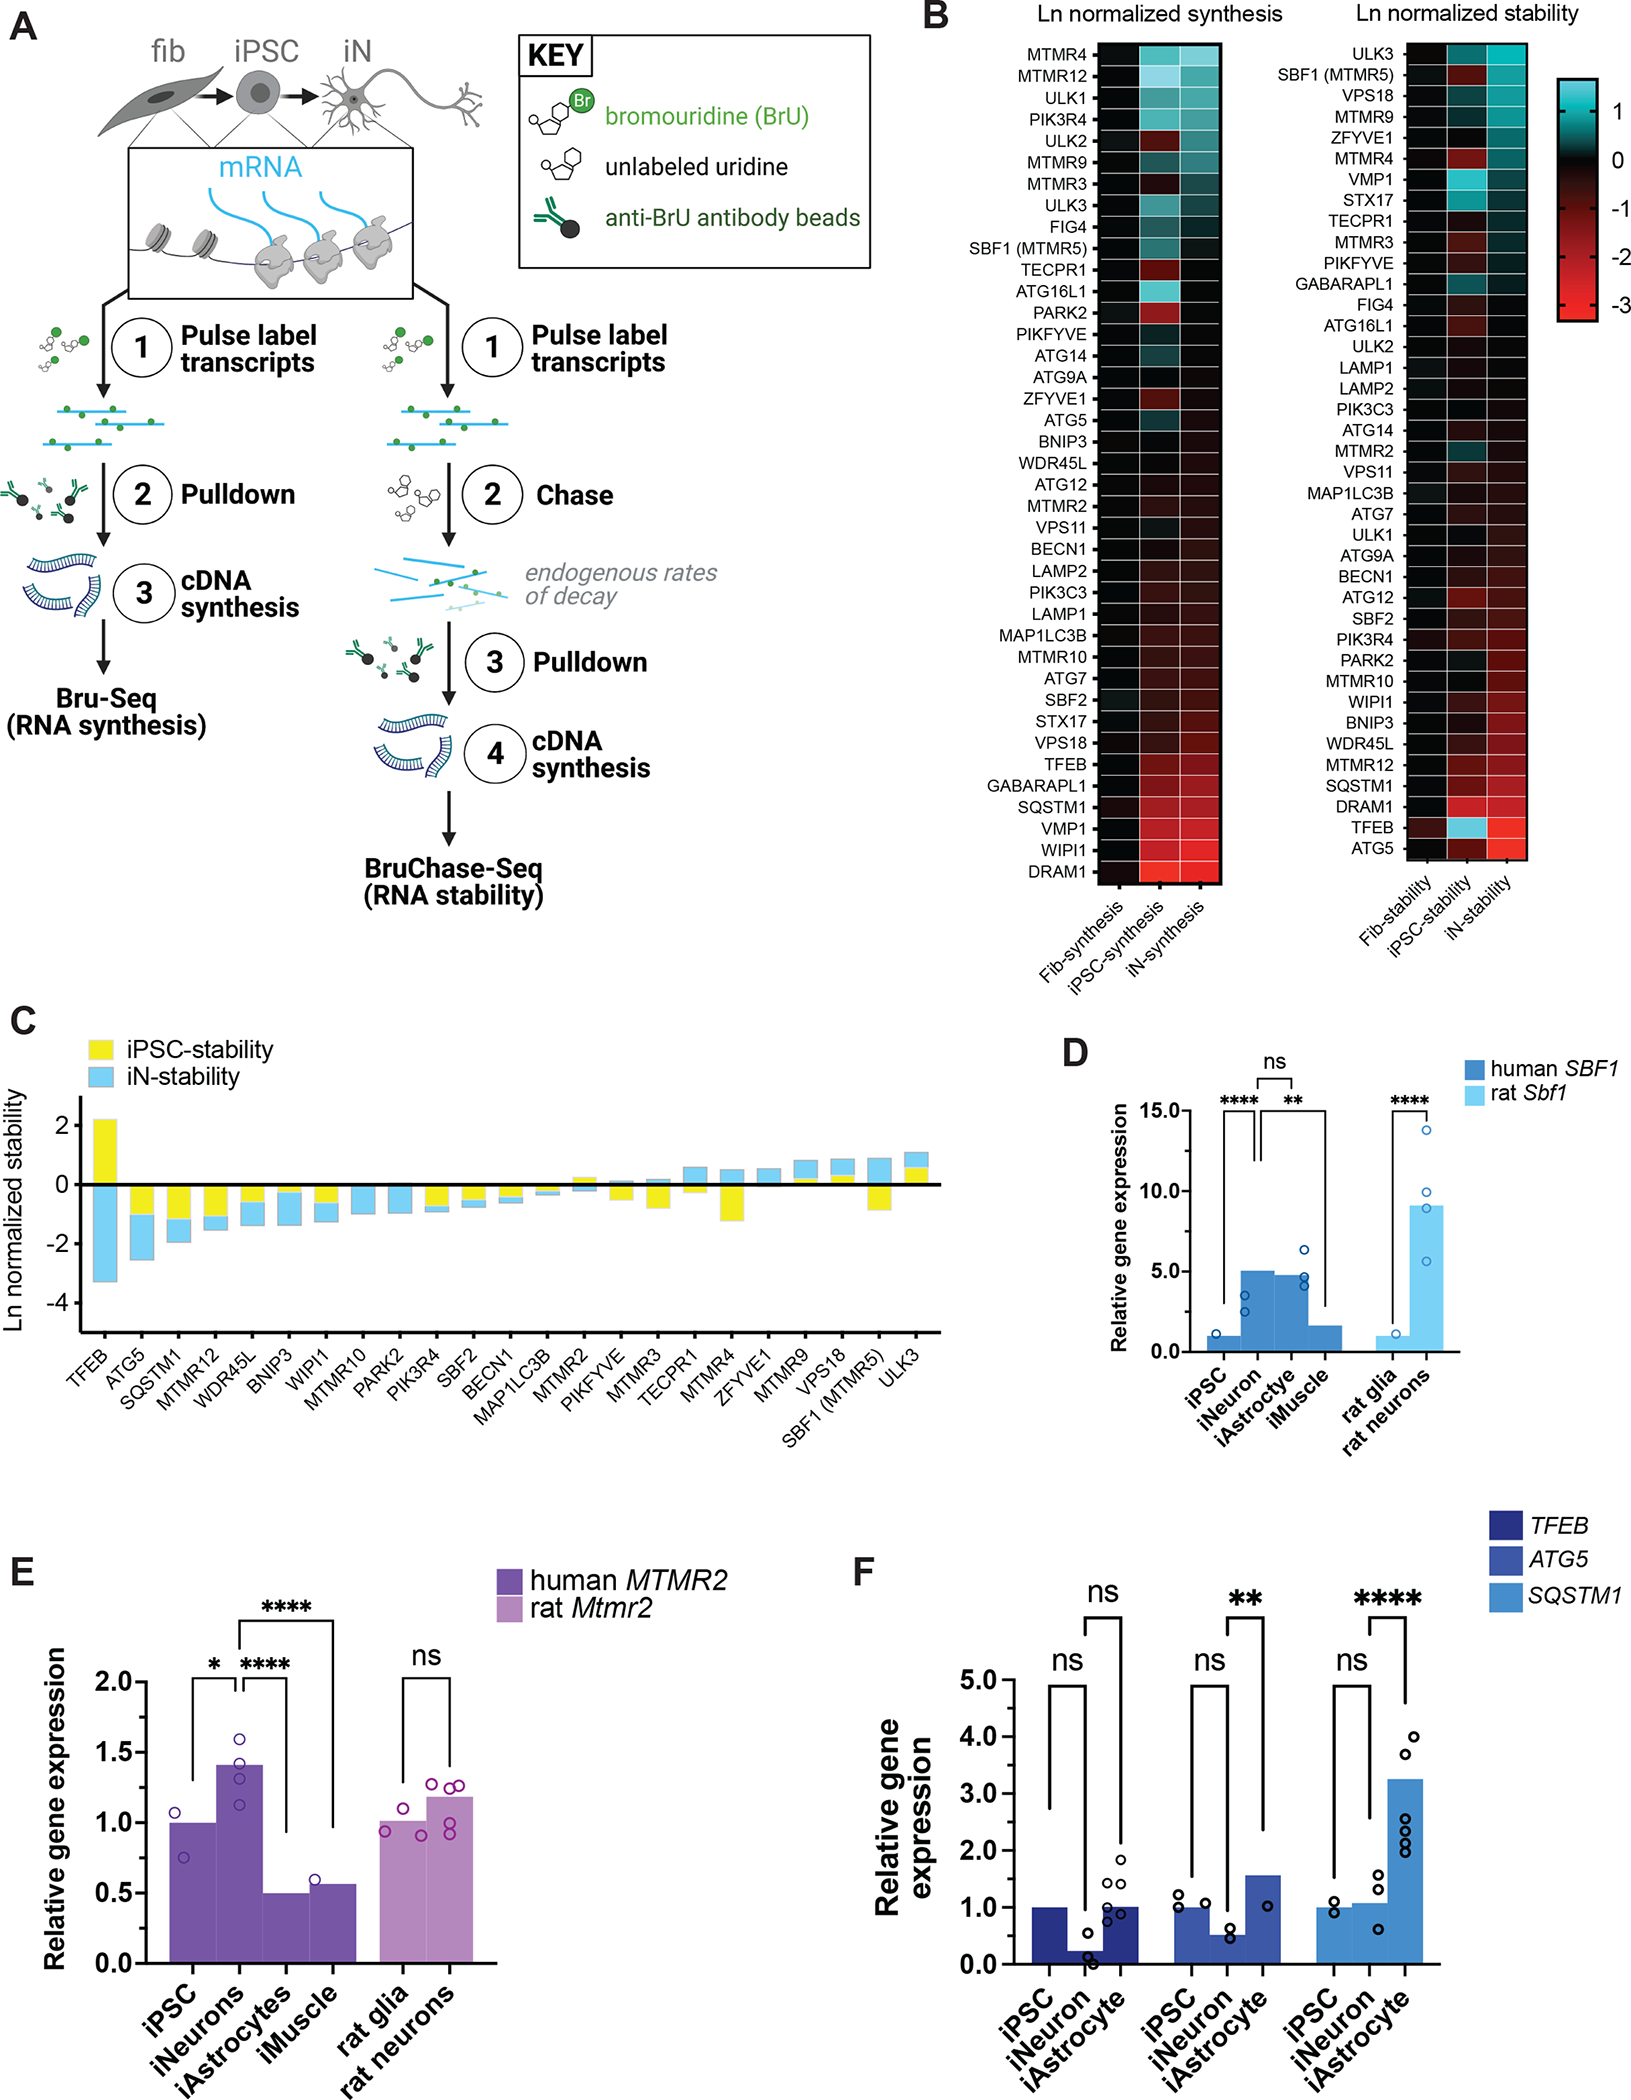
Figure 2. RNA expression of autophagy factors in different cell types.

(A) Schematic of Bru-Seq and BruChase-Seq. RNA transcripts from fibroblasts, iPSCs reprogrammed from the fibroblasts, and iNeurons differentiated from the same iPSCs were pulse-labeled with bromouridine with and without chasing with unlabeled uridine, followed by pulldown with anti-bromouridine antibody beads, then subjected to RNA-Seq. (B) Heatmaps of RNA synthesis data from Bru-Seq (left) and RNA stability data from BruChase-Seq (right), plotted for each cell type and natural log (Ln)-normalized to fibroblasts. Fib, fibroblast; iPSC, induced pluripotent stem cell; iN, iNeuron. (C) Bar graph of RNA stability data from BruChase-Seq, Ln-normalized to fibroblasts. SBF1 was among the most stable RNA transcripts. (D) RT-PCR measurements of total steady-state human SBF1 or rat Sbf1 RNA in each cell type indicated. **p<0.01, ****p<0.0001, one-way ANOVA. (E) RT-PCR measurements of human MTMR2 or rat Mtmr2 RNA in the indicated cell types. ns, not significant; *p<0.05; ****p<0.0001, one-way ANOVA. (F) RT-PCR measurements of human TFEB, ATG5, or SQSTM1 RNA in each cell type indicated. ns, not significant; **p<0.01; ****p<0.0001, one-way ANOVA. See also Figure S5.
