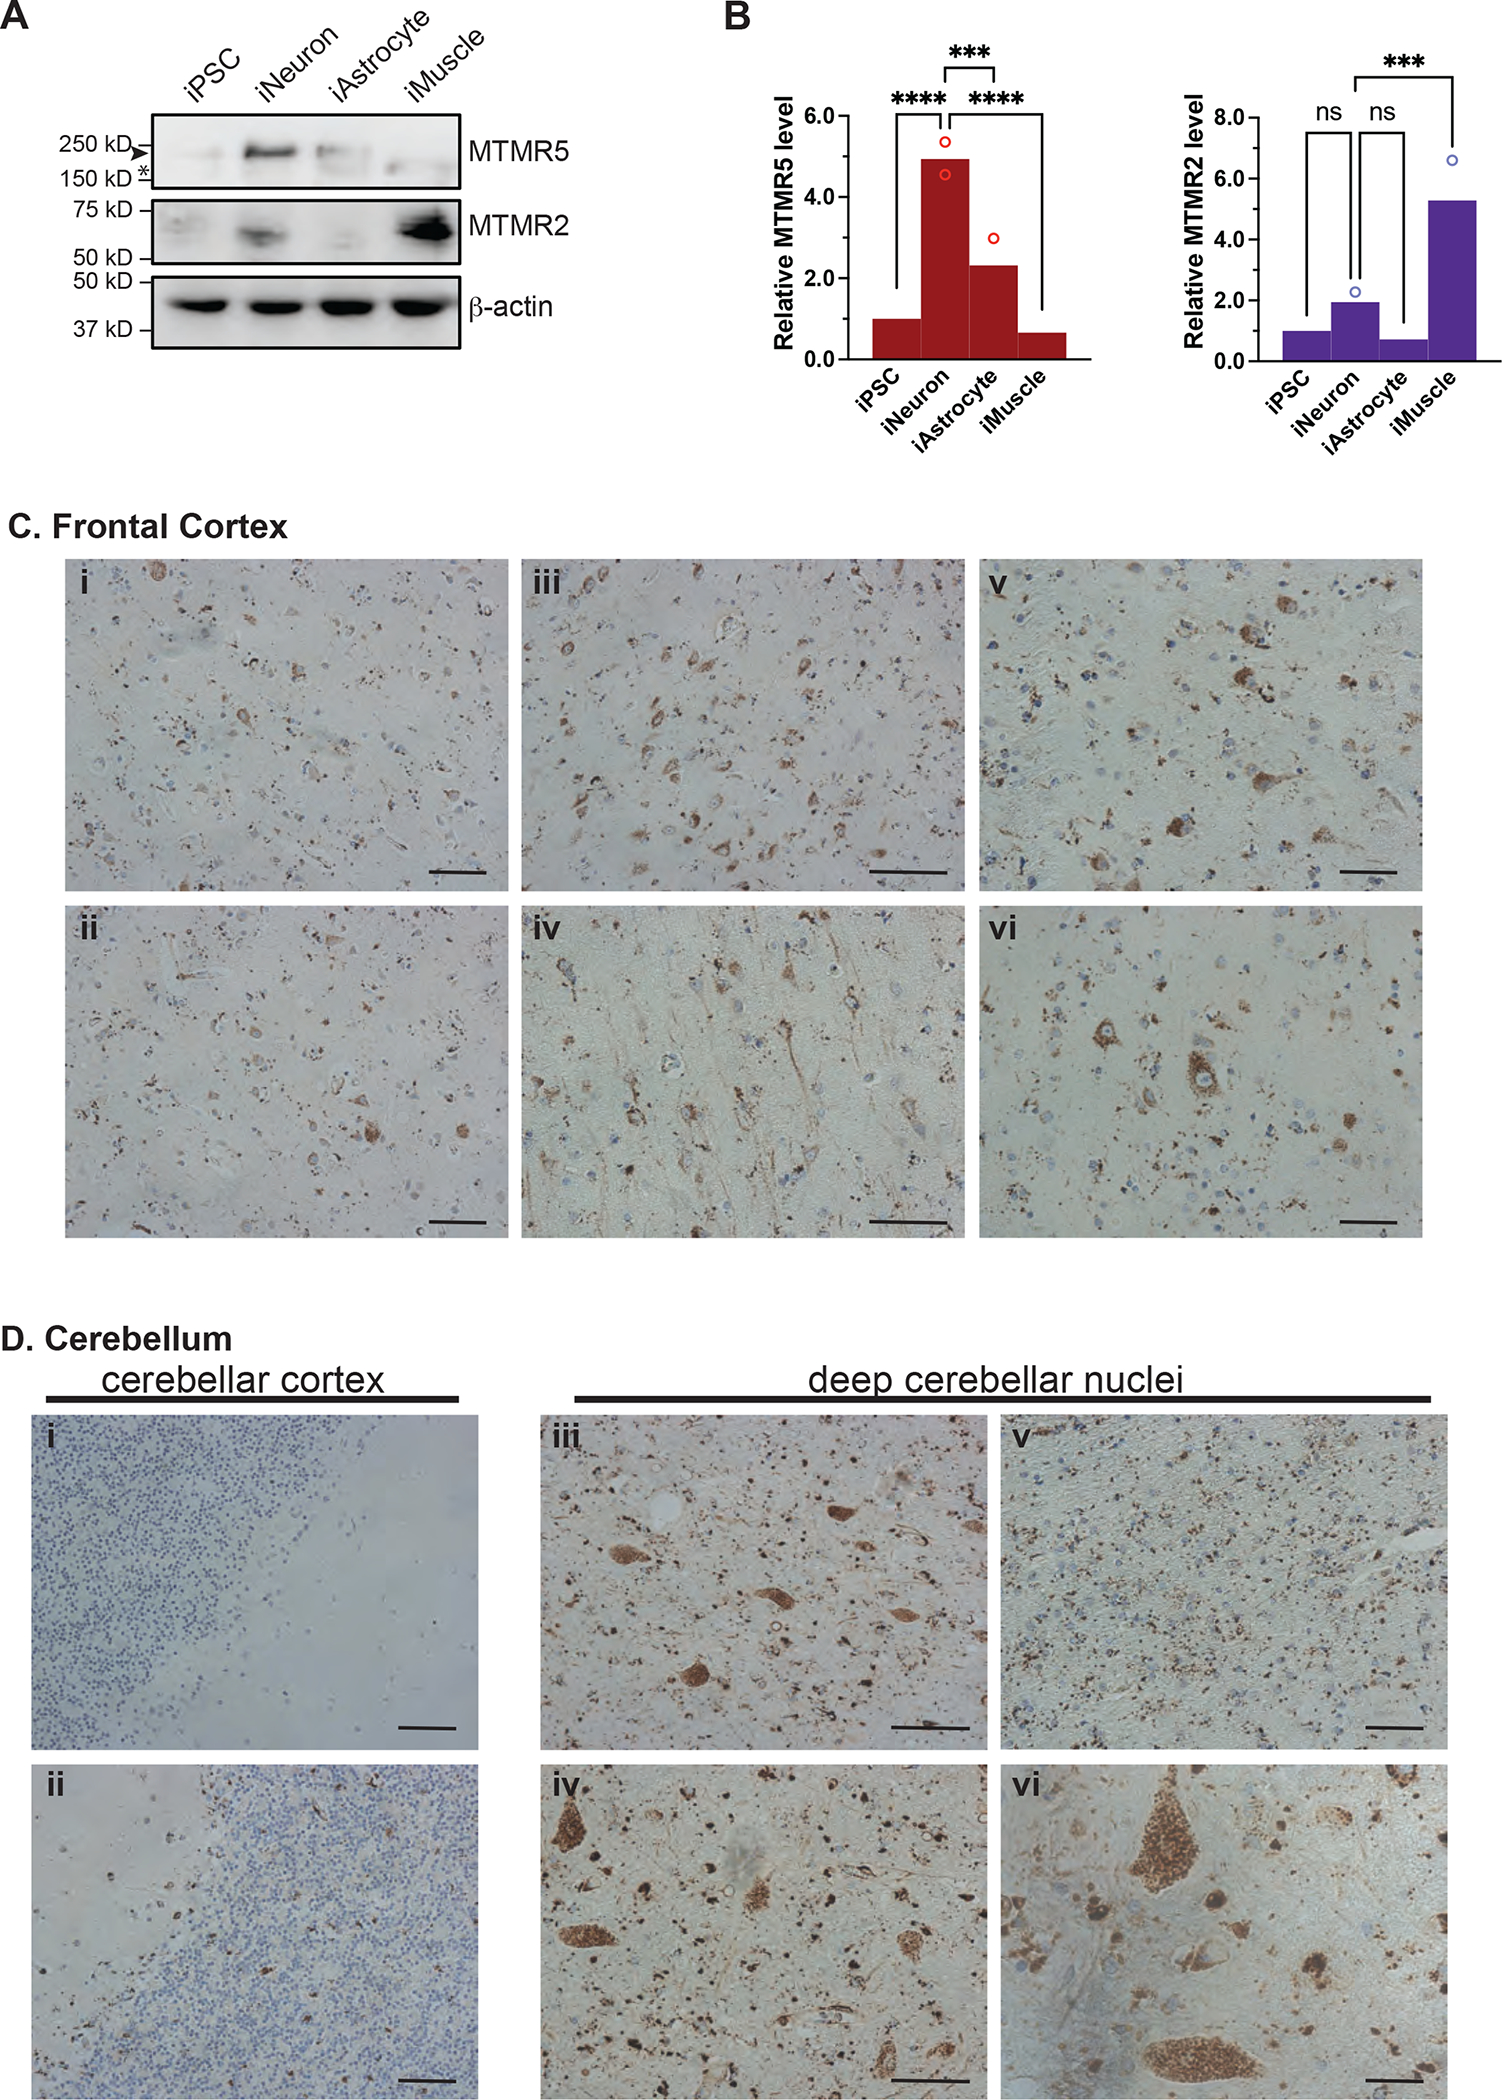
Figure 3. MTMR5 protein is enriched in neurons.

(A) Representative Western analysis of MTMR5, MTMR2, and actin loading control in each of the cell types indicated. Arrowhead, MTMR5, 208kD; asterisk, non-specific band. (B) Band intensity quantifications of MTMR5 and MTMR2 as depicted in (A), normalized to actin band intensity. Data are from three independent experiments. ns, not significant; ***p<0.001; ****p<0.0001, one-way ANOVA. (C) Immunohistochemical staining of MTMR5 in sections of human frontal cortex (i–iv, 10x magnification, scale bar 40μm; v–vi, 20x magnification, scale bar 20μm), and in (D) cerebellum (i–ii, cortex; iii–v deep cerebellar nuclear nuclei, 10x, scale bar 30μ; vi deep cerebellar nuclei, 20x; scale bar 10μm).
