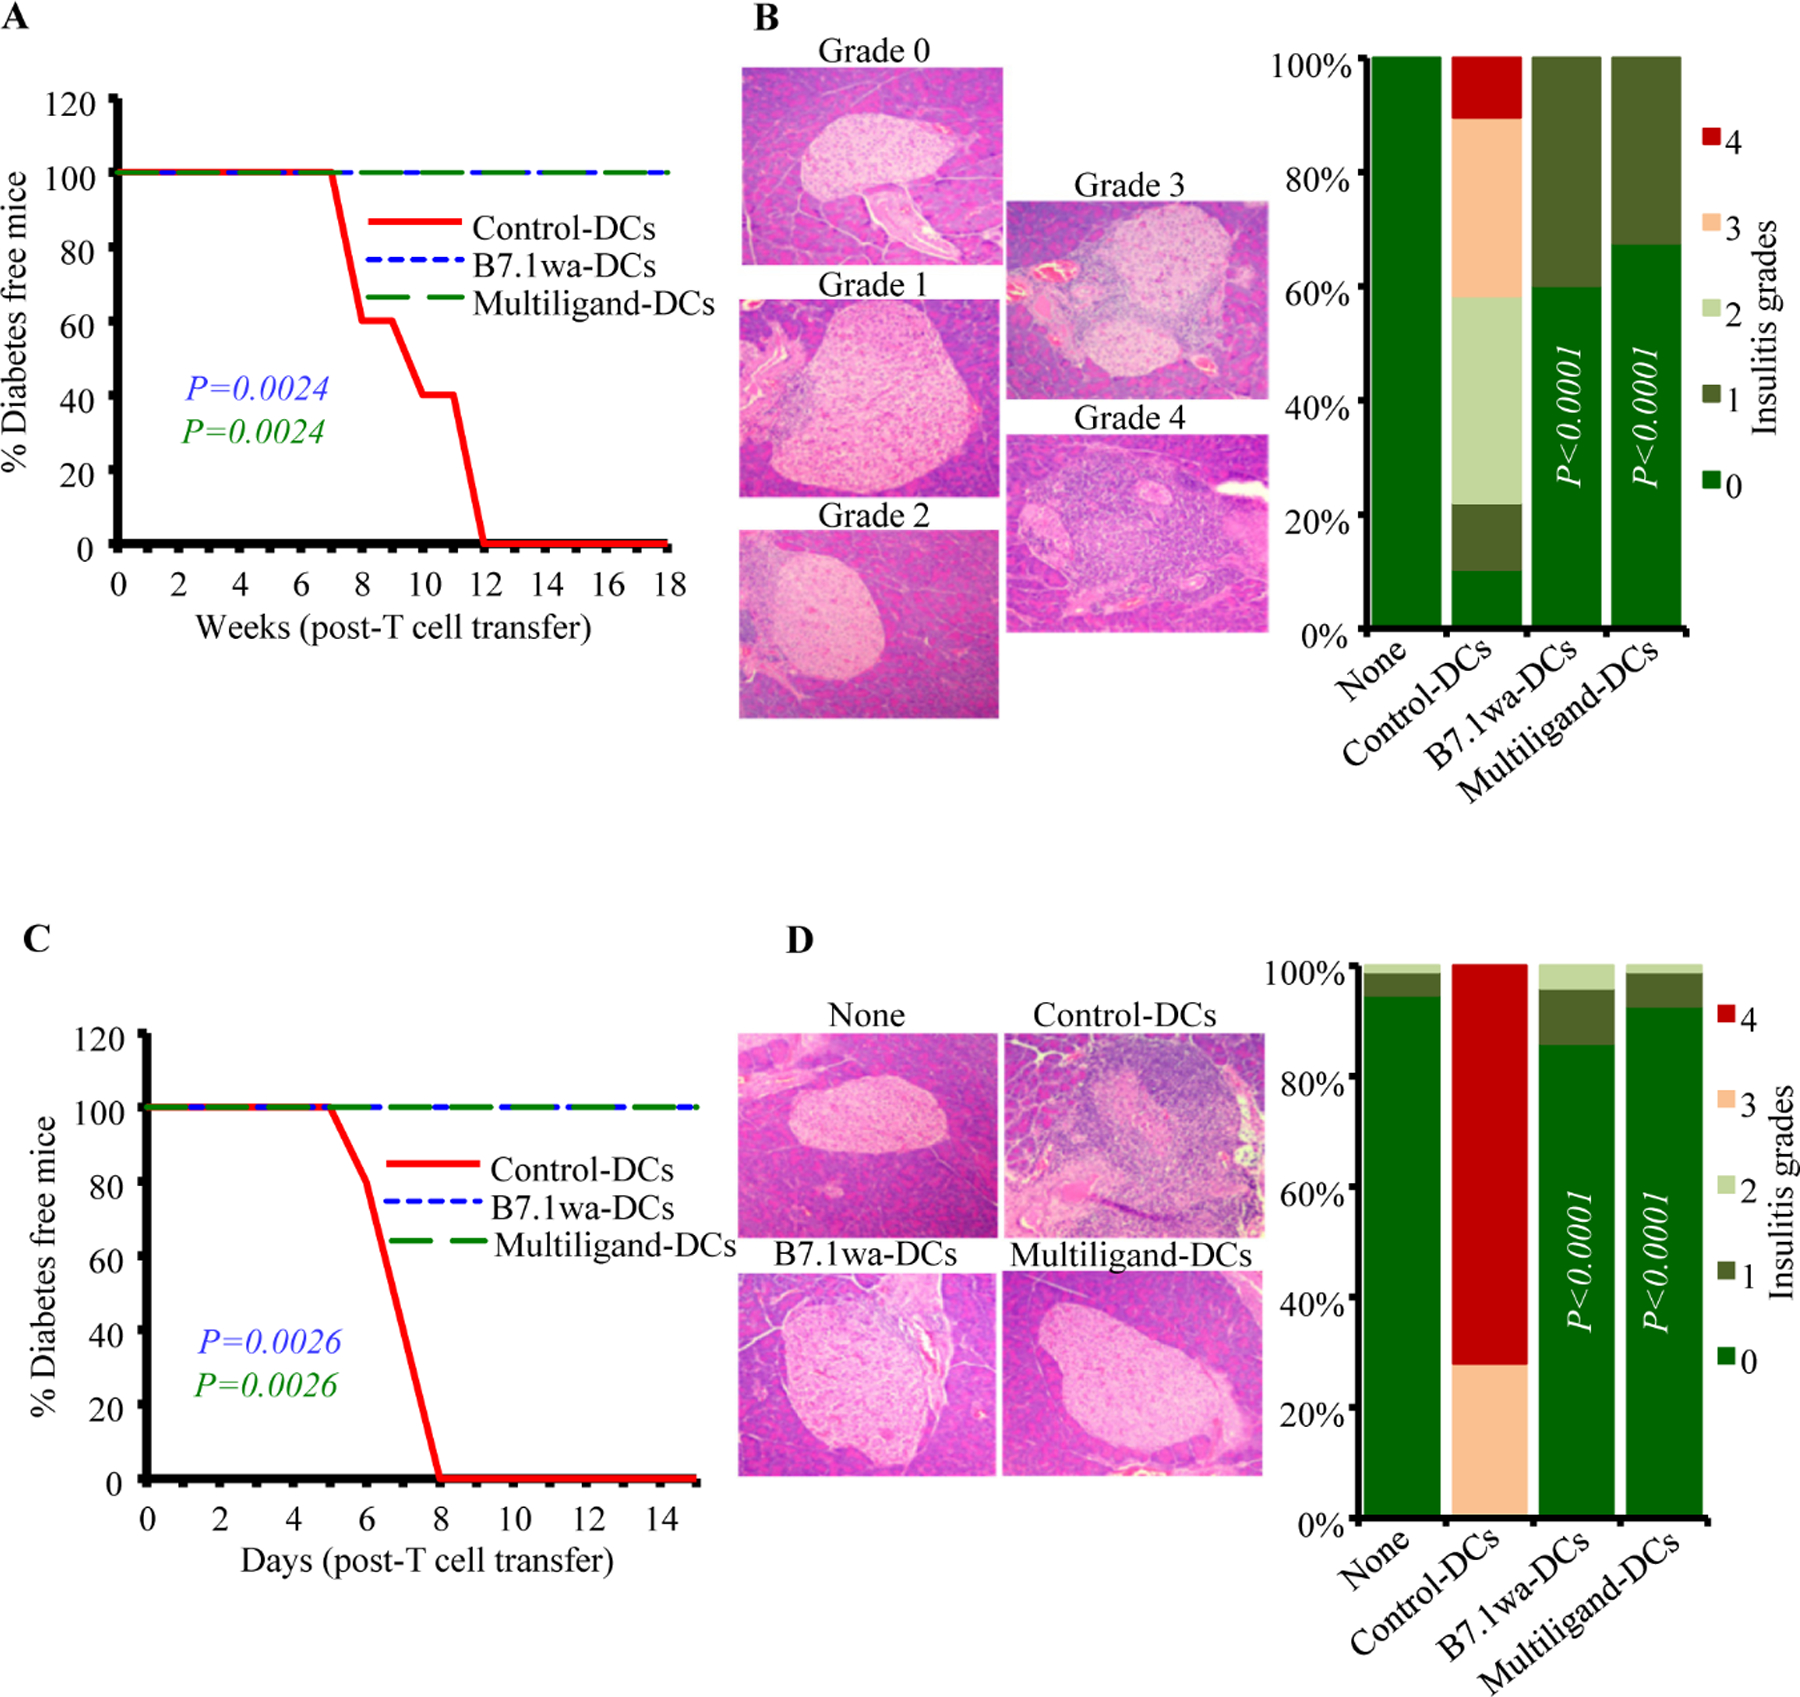
FIGURE 2: Diabetogenic properties of T cells activated in vitro using engineered-DCs.

PnLN T cells from early-hyperglycemic WT-NOD mice and CD4+ T cells from BDC2.5 mice were subjected to primary culture in the presence of various DC preparations for 4 days as described for Fig. 1. A&B) Live T cells from primary cultures of WT PnLN T cells were enriched and injected i.v. into 6-week-old female NOD-Rag1−/− mice (1×10⁶ cells/mouse) and tested for blood glucose levels every week for up to 18 weeks (A; 5 mice/group) or euthanized 30 days post-cell transfer (B; 4 mice/group). pCDH1-multiligand vector, instead of individual ligand vectors, was used for generating multiligand-DCs for panels A&B. C&D) Live T cells from the primary cultures of BDC2.5 cells were injected i.v. into 4-week-old WT male NOD mice and tested for blood glucose levels every week for up to 15 weeks (C; 5 mice/group) or euthanized 5-days post-cell transfer (D; 4 mice/group). At least 120 islets from intermittent sections were examined for each group (at least 30 islet areas/mouse) for panels B and D. P-values by log-rank test for panels A and C, and Fisher’s exact test for panels B and D. All P-values are in comparison with control-DC group. Group “none” did not receive T cells.
