Figure 8.

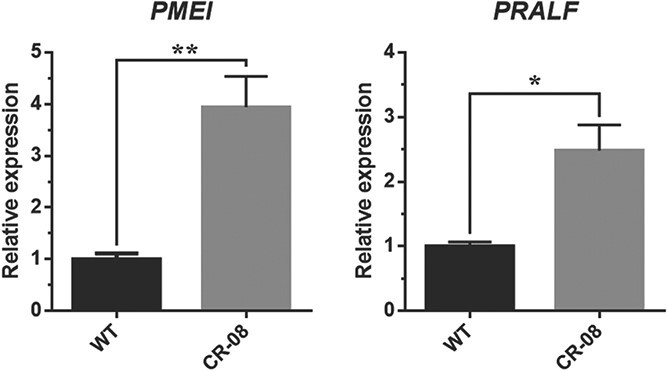
Transcriptional analysis of pollen-specific genes in WT and CR-08 lines. Each value represents the mean ± standard deviation of three replicates. Asterisks indicate a significant difference (*P < .05, **P < .01) between WT and CR-08 lines.

Transcriptional analysis of pollen-specific genes in WT and CR-08 lines. Each value represents the mean ± standard deviation of three replicates. Asterisks indicate a significant difference (*P < .05, **P < .01) between WT and CR-08 lines.