
Figure 4. Generation of cardiac tissues.
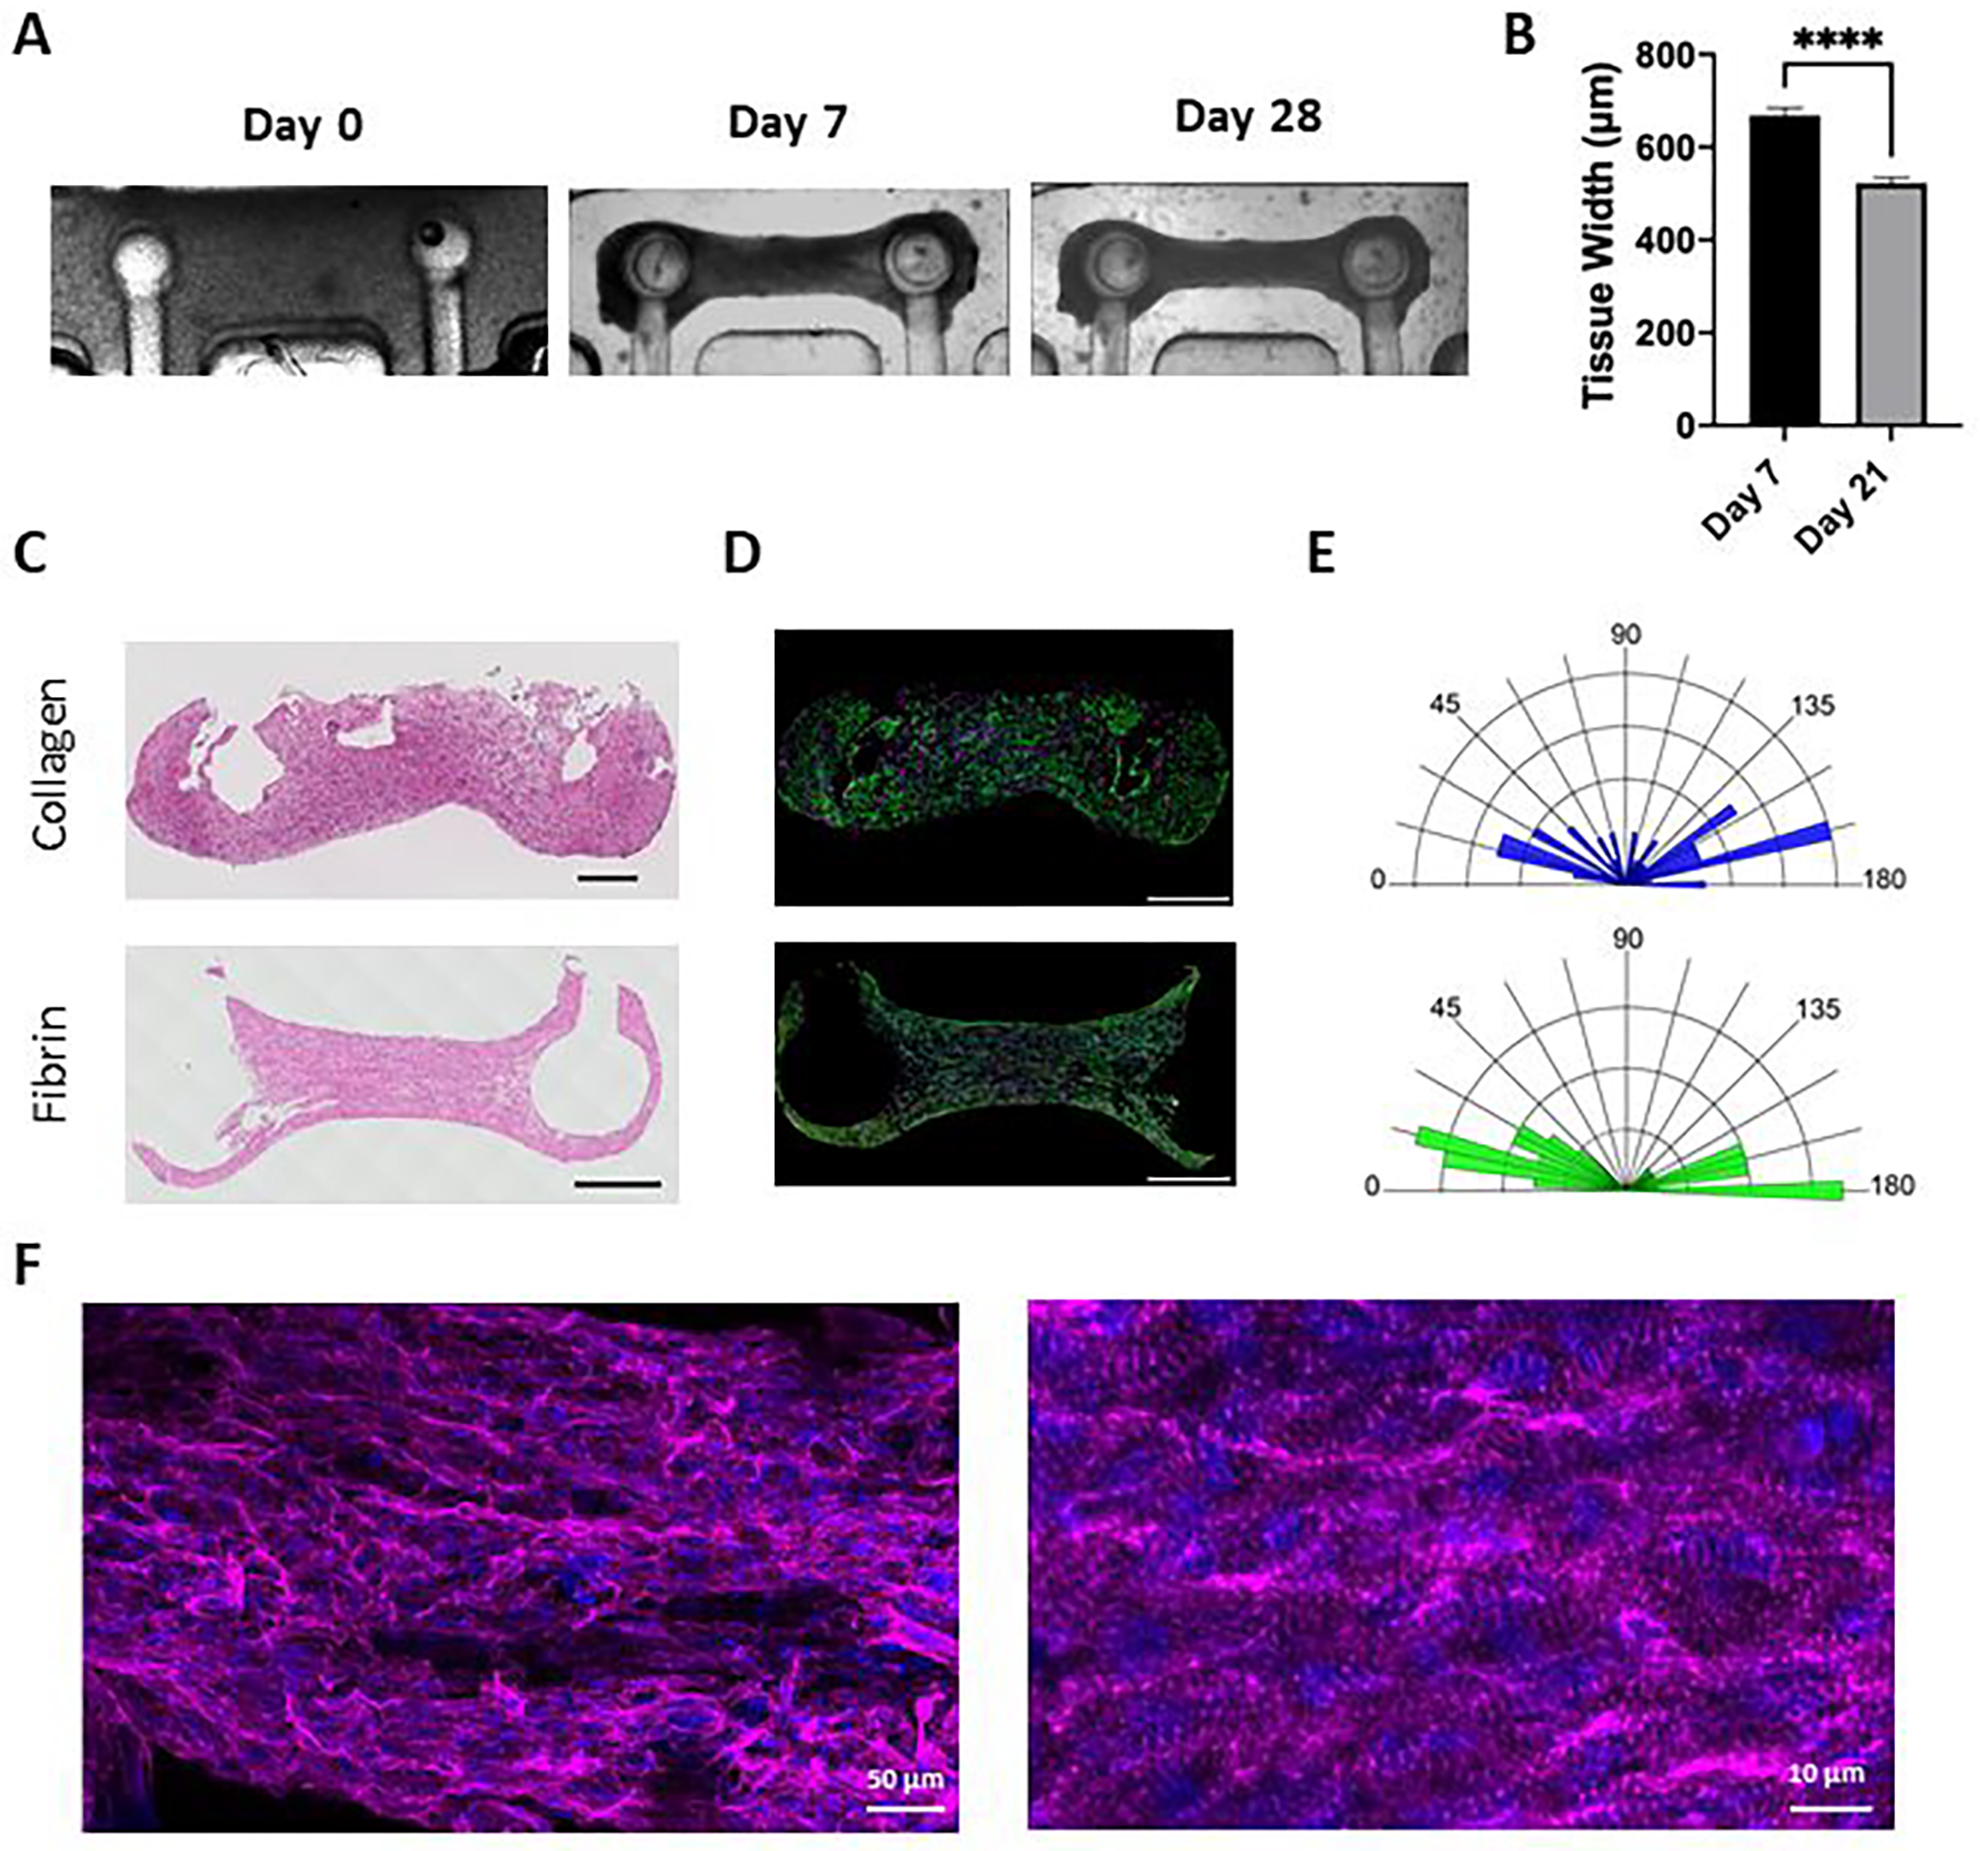
(A) Representative brightfield images of millPillar tissues immediately after seeding into the platform (Day 0), before electrical stimulation (day 7) and at the end of 21 days of ramp electrical stimulation (day 28). (B) Impact of culture period and electrical stimulation on milliPillar tissue width before and after electrical stimulation. Representative images of (C) Hematoxylin and Eosin (H&E) staining and (D) immunostaining for troponin-T (green), vimentin (magenta) and nuclei (blue) staining of milliPillar tissues formed using collagen and fibrin hydrogels and electrically stimulated for 21 days (scale bar, 500 μm). (E) Quantification of iPS-cardiomyocytes alignment in collagen and fibrin tissues. (F) Representative confocal images of fibrin tissues electrically stimulated with ramp stimulation regimen and immunostained for sarcomeric α-actinin (magenta), and nuclei (blue).