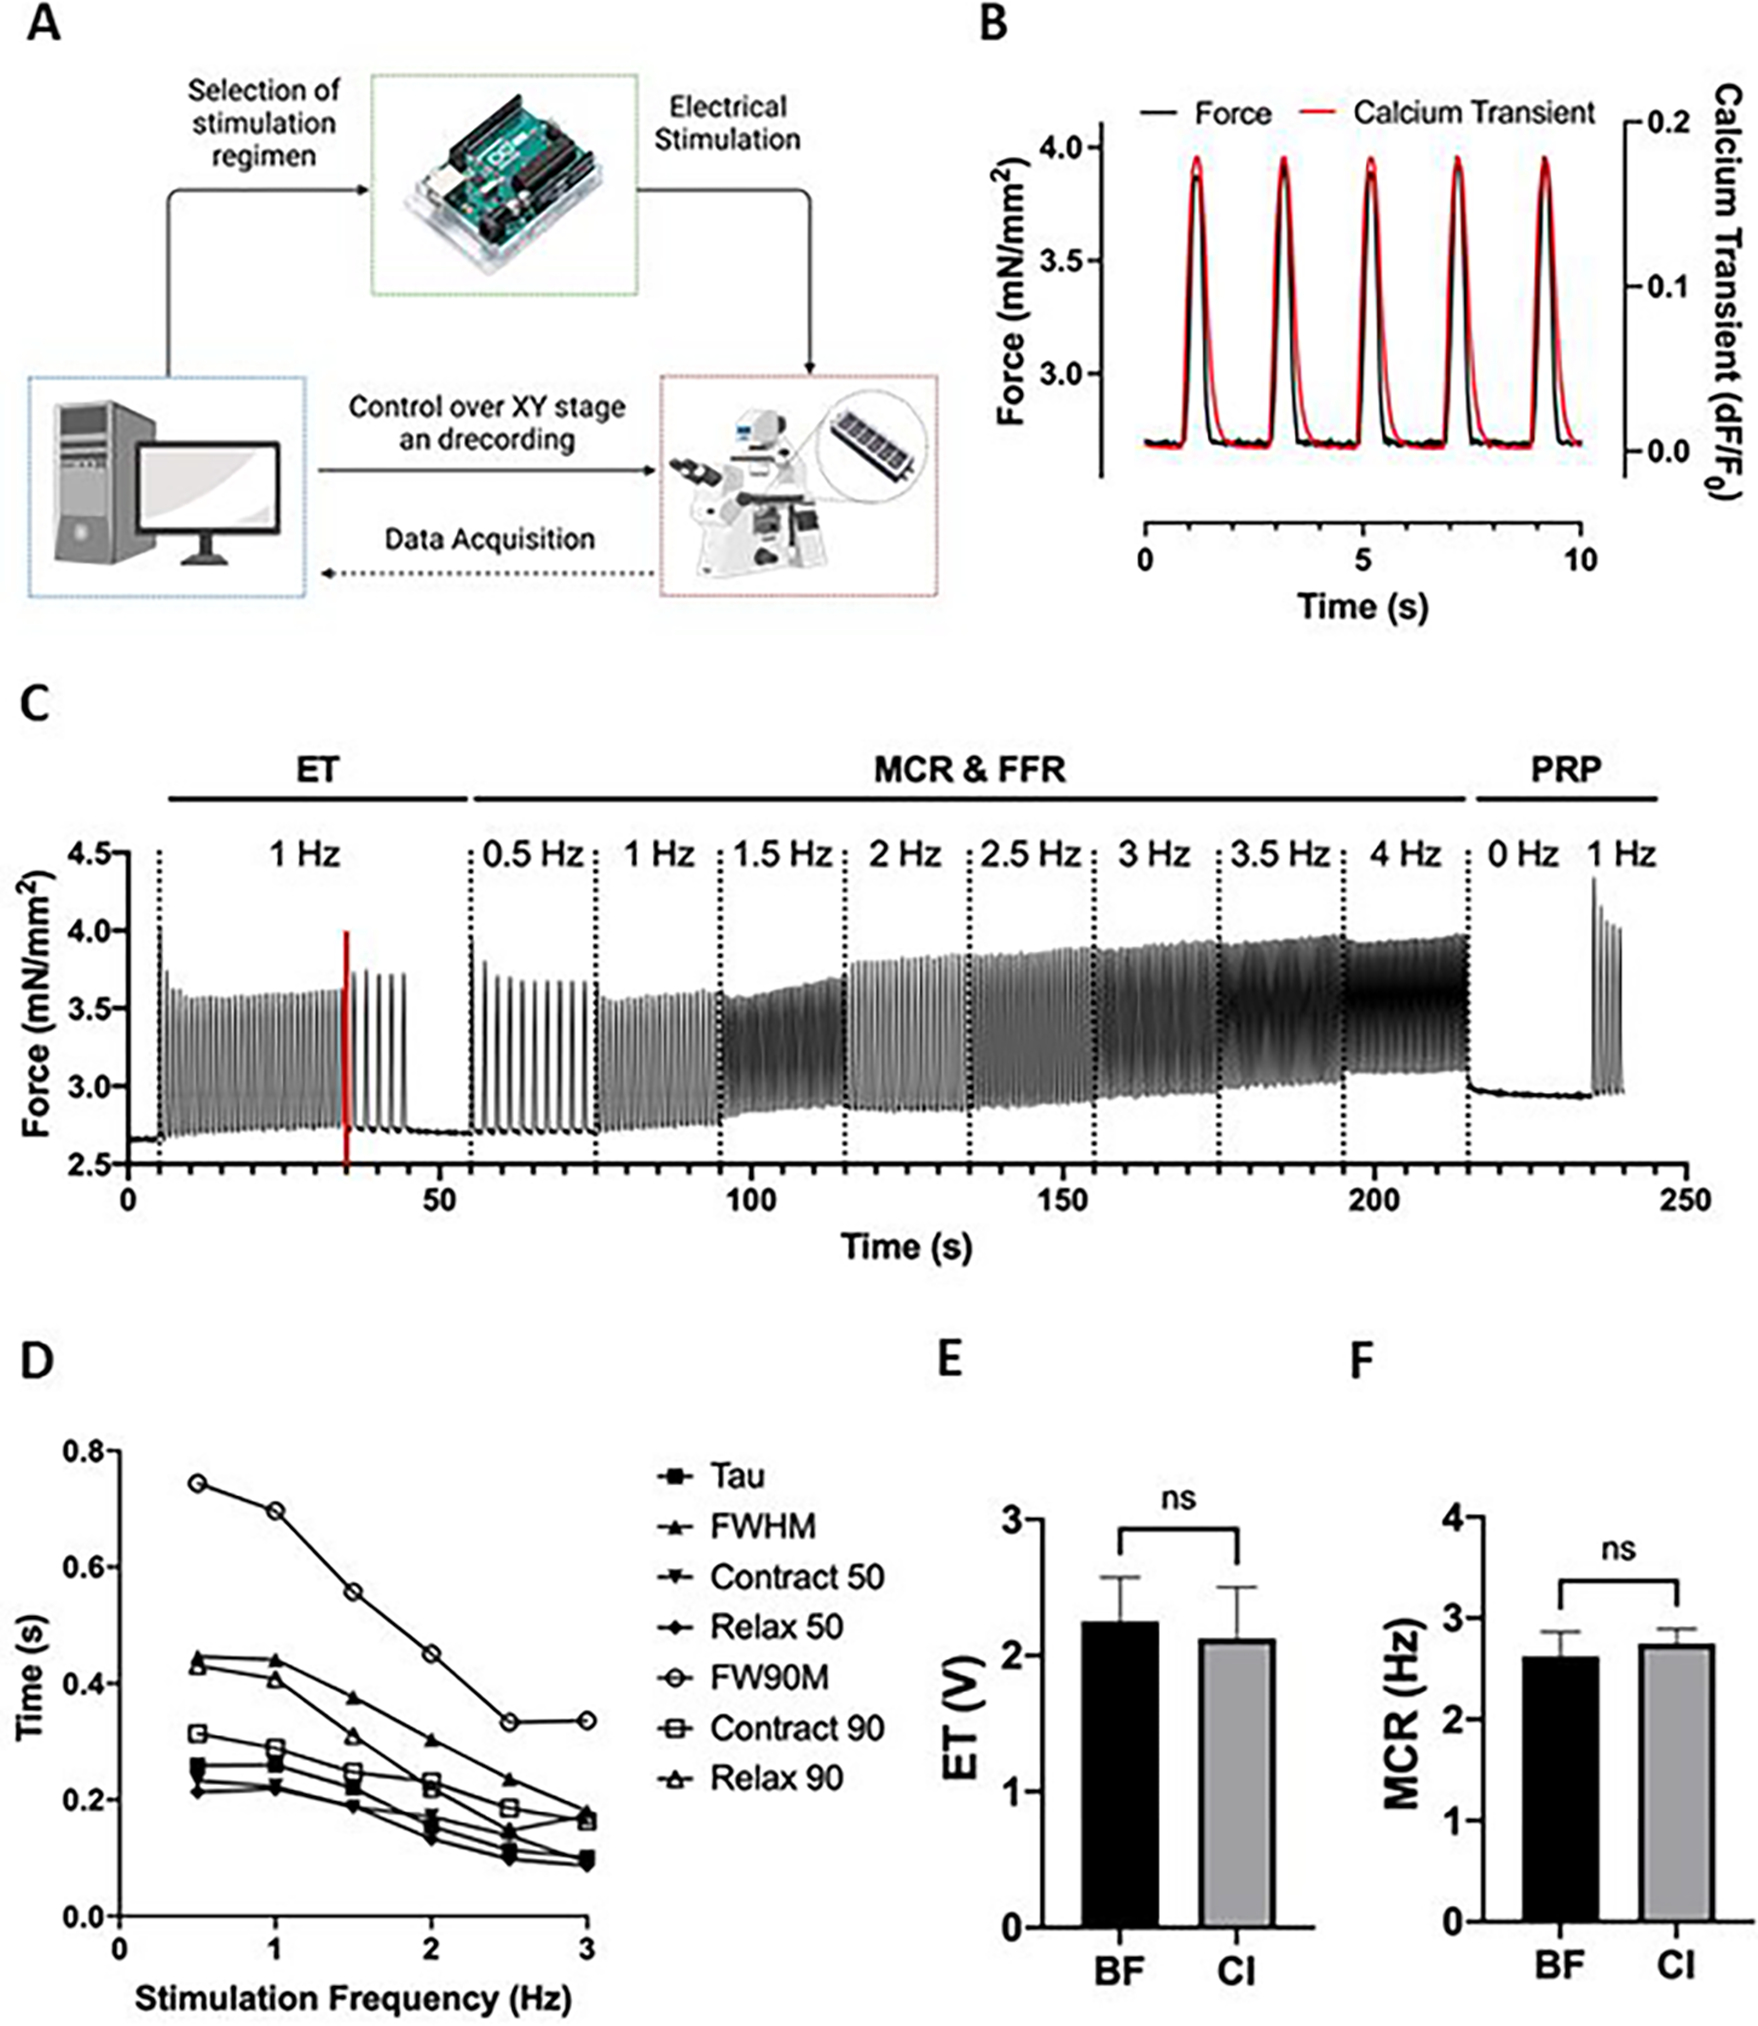
Figure 5. Custom software and hardware for functional analysis of cardiac tissues.

(A) Overview of the system that enables simultaneous and automated tissue stimulation, microscopy video recordings, and microscope stage movement between multiple tissues in the XY axes. (B) Representative traces of calcium signal and force generation of milliPillar tissues stimulated at 0.5 Hz of which absolute force and time measurements are extracted. (C) Representative trace of milliPillar tissues in response to the combined custom stimulation regimen that enables the measurement of ET, MCR, maximum beating frequency, force generation, contraction and relaxation velocity, and the characterization of FFR. (D) Representative measurements of calcium handling parameters (Tau, FWHM, Contract 50, Relax 50, FW90M, Contract 90, and Relax 90) across varying stimulation frequencies. (E) ET and (F) MCR measurements extracted from brightfield (BF) and calcium imaging (CI) videos demonstrate similar values.
