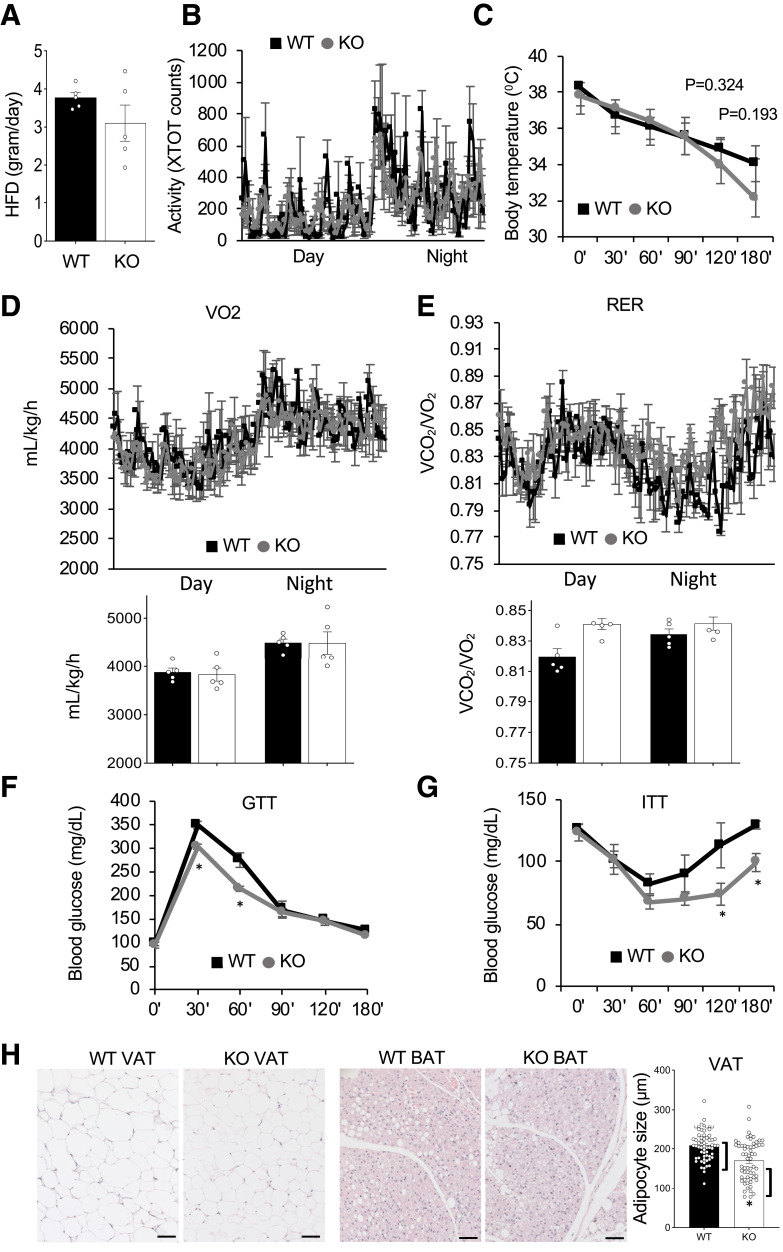
Figure 3.
PHB1 EC-KO mice have a metabolic phenotype on HFD. For all panels, WT and PHB1 EC-KO male littermates (n = 5) were analyzed at 62 weeks of age after 3 months on the HFD. A: HFD consumption is similar. B: Spontaneous locomotor activity is similar. XTOT, total number of x-axis infrared-beam breaks. C: Cold tolerance in mice placed at 4°C. D: VO2 consumption measured by indirect calorimetry with average night and day VO2 plotted below. E: RER (VCO2/VO2) with average night and day plots below showing a significant increase. F: GTT in overnight fasted mice. G: ITT in 4 h-fasted mice. H: Hematoxylin and eosin staining of VAT and BAT. Graph: Quantification of adipocyte size in H by ImageJ. In all panels, scale bar: 50 µm. Plotted data are mean ± SEM. *P < 0.05 (Student t test).

