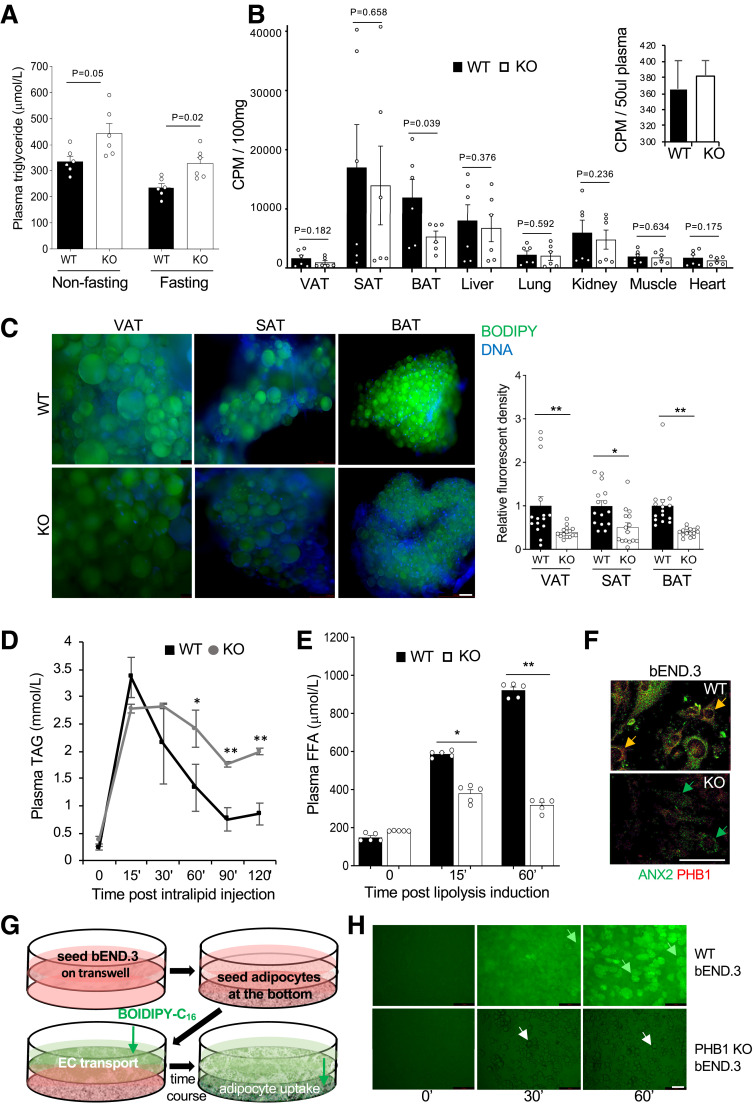
Figure 4.
Lipid metabolism suppression in PHB1 EC-KO mice. A: Plasma TAG concentration in circulation in overnight fasted and nonfasted males (n = 3). B: In vivo LCFA uptake: data combined from two independent experiments. Upon iv administration of [3H]palmitate after 30 min of circulation and subsequent perfusion to clear [3H]palmitate in circulation, liquid scintillation counts per minute (CPM) were measured on indicated resected tissues. Inset: [3H]palmitate in blood prior to perfusion. C: BODIPY-C16 uptake by VAT, SAT, and BAT adipocytes in WT and KO mice 3 h after iv injection. Green fluorescence was imaged in cell suspension upon tissue digestion with collagenase. Graph: Quantification of BODIPY-C16 signal in (C) by ImageJ. D: TAG blood concentration analysis upon iv intralipid infusion into prestarved mice shows a delay in clearance for KO littermates compared with WT. *P < 0.05, **P < 0.01 (Student t test). E: Plasma concentration of FFA after isoproterenol injection increases less in KO mice than in WT. A–E: Experiment used 8-month-old males raised on chow. F: Expression of PHB1 and ANX2 in b.END3 cells (parental and PHB1-KO) detected by IF. G: Schematic of the assay (H) measuring LCFA transport across a monolayer of bEND.3 endothelial cells. H: WT and PHB1-KO bEND.3 were grown to 100% confluency on the top of the 0.4-µm pore transwells; adipocytes differentiated from WT MEFs were seeded in the bottom of the wells. BODIPY-C16 (2 µmol/L) was added to the upper chamber, and then adipocytes in the lower chamber were imaged after the time indicated. LCFAs are transported through control bEND.3 cells and deposited into adipocytes (green arrows), PHB1-KO bEND.3 cells do not transport LCFAs into adipocytes (white arrows). In all panels, data plotted are mean ± SEM. *P < 0.05, **P < 0.01 (Student t test). Scale bar: 50 µm.

