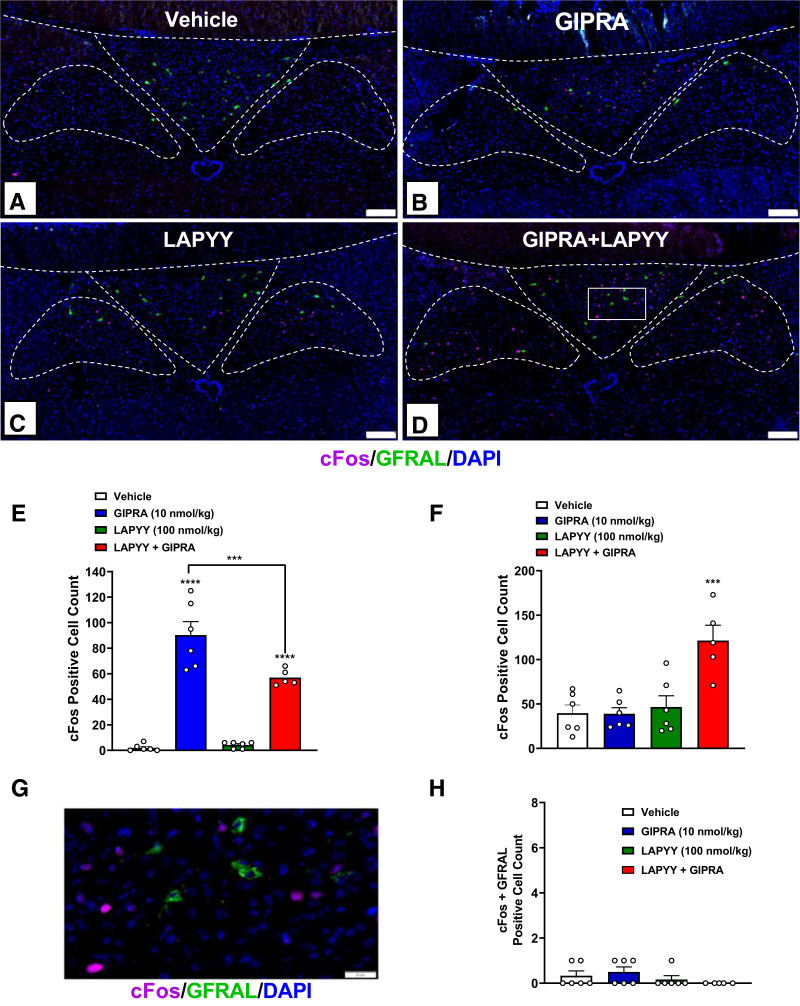
Figure 6.
Activation of brainstem neurons by GIPRA and LAPYY at 45 min posttreatment. Representative brainstem immunofluorescent images of mice receiving vehicle (A), a GIPRA (10 nmol/kg) (B), an LAPYY analog (100 nmol/kg) (C), and GIPRA + LAPYY analog (D) (n = 6 per group). Neuronal activities (cFos+ cell counts) in the AP (E) and NTS (F) at 45 min postinjection were quantified. G: High-magnification image representing the square in D shows nonoverlapping pattern of cFos and growth differentiation factor 15 receptor (GFRAL). H: Quantification of cFos and GFRAL double-positive cells in AP. For all immunofluorescent images, cFos, purple; GFRAL, green; DAPI, blue. Values are means ± SEM. Statistical analyses included one-way ANOVA followed by Dunnett multiple comparison test. ***P < 0.001; ****P < 0.0001. Scale bars in A–D: 100 μm. Scale bar in G: 10 μm.

