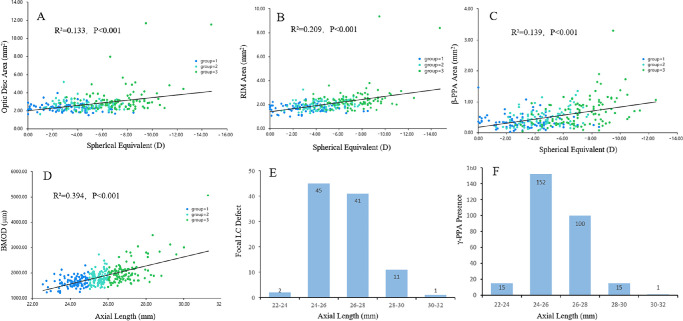
Figure 4.
Scatterplots (A–D) showing the relationships between the spherical equivalent, axial length, and the top three parameters of standardized coefficient value in Table 3. Histogram (E, F) showing the distribution of the focal lamina cribrosa defect and the γ-PPA presence in myopic eyes with different axial lengths.

