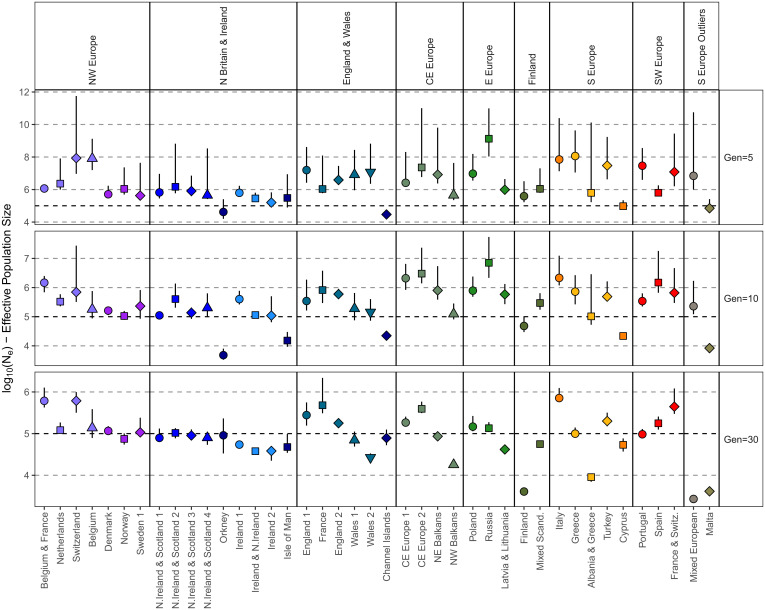
Fig. 4.
Historical population sizes of different European regions. For each group of related Leiden clusters, the point log10 Ne estimated by IBDNe is shown for 5, 15, and 30 generations ago. Clusters are indicated by symbol/color designation, and error bars show the lower and upper 95% confidence intervals obtained with bootstrapping. Plots were generated using the ggplot2 package (65) in the R statistical computing language (59).

