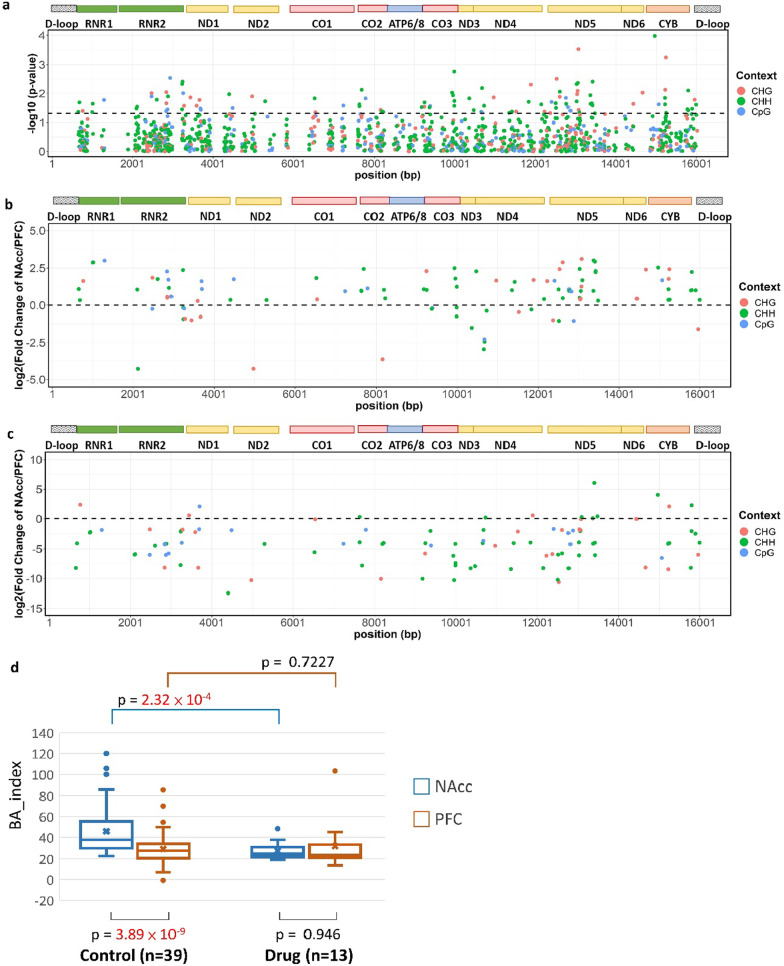
Fig. 2.
The brain area index (BA_index) in the control group and the drug use group. a for the differential methylation levels between the NAcc and the PFC, the Manhattan plot shows the significance level of each cytosine site across the mitochondrial genome. The cytosine sites above the dashed line (P value = 0.05) were selected for constructing the BA_index, and their fold changes of methylation levels between the NAcc and the PFC are shown in b. c The scatter plot shows the fold changes of methylation levels between the NAcc and the PFC from the selected cytosine sites in the drug use group. a–c The encoded genes are shown at the top of each plot, and the color of the dot represents the sequence context. d The box plot shows the distribution of the BA_index scores in different brain areas and groups. The P values are shown in the plots.

