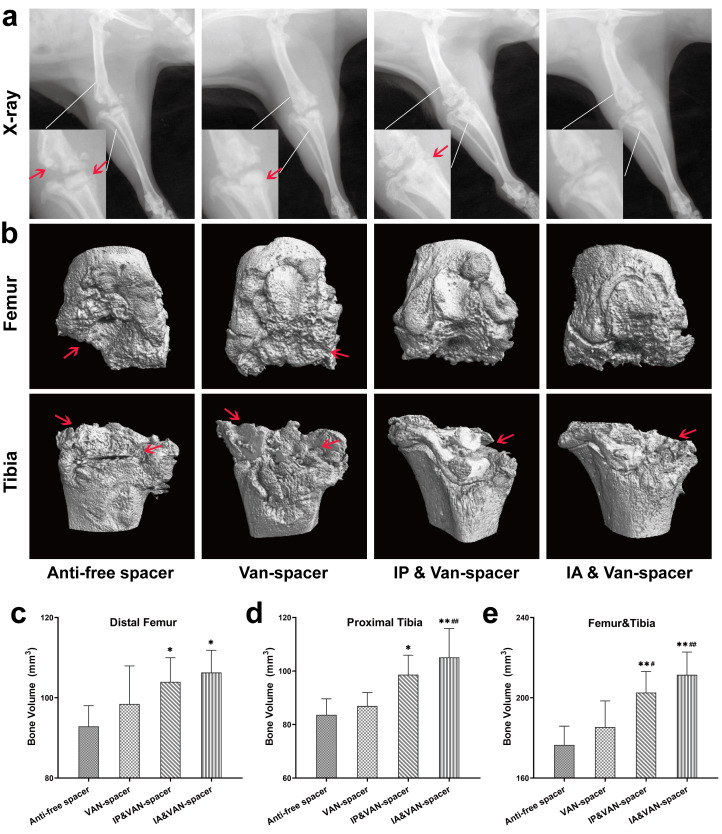
Fig. 3.
Radiological evaluation of the knee joint in four treatment groups of rats on day 28. a) Radiograph of the right hind limb. b) 3D CT scan and bone reconstruction of the distal femur and proximal tibia. c) Bone volume (BV) analysis of the distal femur of micro-CT. d) BV analysis of the proximal tibia of micro-CT. e) Total BV analysis of the distal femur and proximal tibia of micro-CT. The four treatment groups were as follows: Control (antibiotic-free cement spacer); Van-Cement spacer (4 g vancomycin per 40 g cement powder); intraperitoneal (IP) & Van-Cement spacer (4 g vancomycin per 40 g cement powder, and IP injection of vancomycin, 88 mg/kg, 1 ml, every 12 hours); intra-articular (IA) & Van-Cement spacer (4 g vancomycin per 40 g cement powder, and IA injection of vancomycin, 44 mg/kg, 150 µl, once per day); n = 6. The data in the figures represent the means and standard error of the means. Significance was evaluated using a Mann–Whitney U test for the comparison of bone volume. *p < 0.05, **p < 0.01 (compared with Control group), #p < 0.05, ##p < 0.01 (compared with Van-spacer group). The red arrow indicates the position of bone destruction in the distal femur or proximal tibia.

