
FIGURE 2.
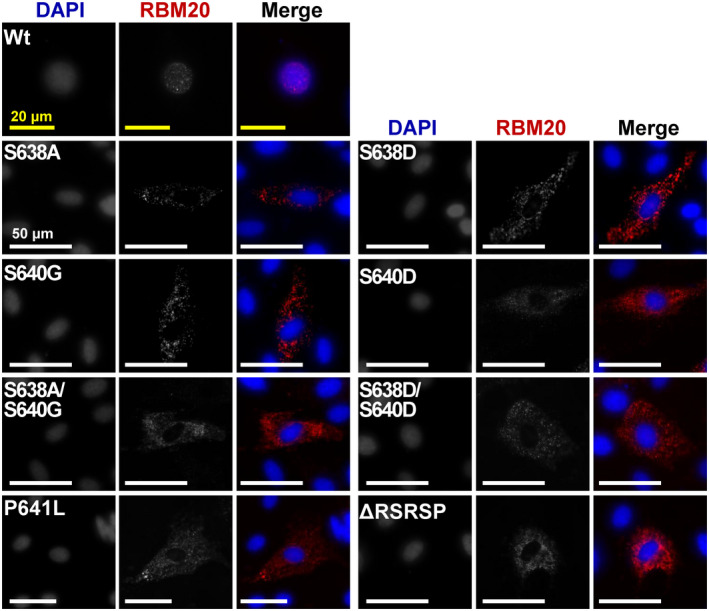
Immunofluorescence staining of Rbm20 mutations in H9c2 cells. Subcellular localization of RBM20 in H9c2 cells via transfection with various Rbm20 mutated plasmids. Single‐channel images are shown in grayscale, and RBM20 and nucleus are shown as red and blue, respectively, in merge images. Yellow bar = 20 µm and white bar = 50 µm