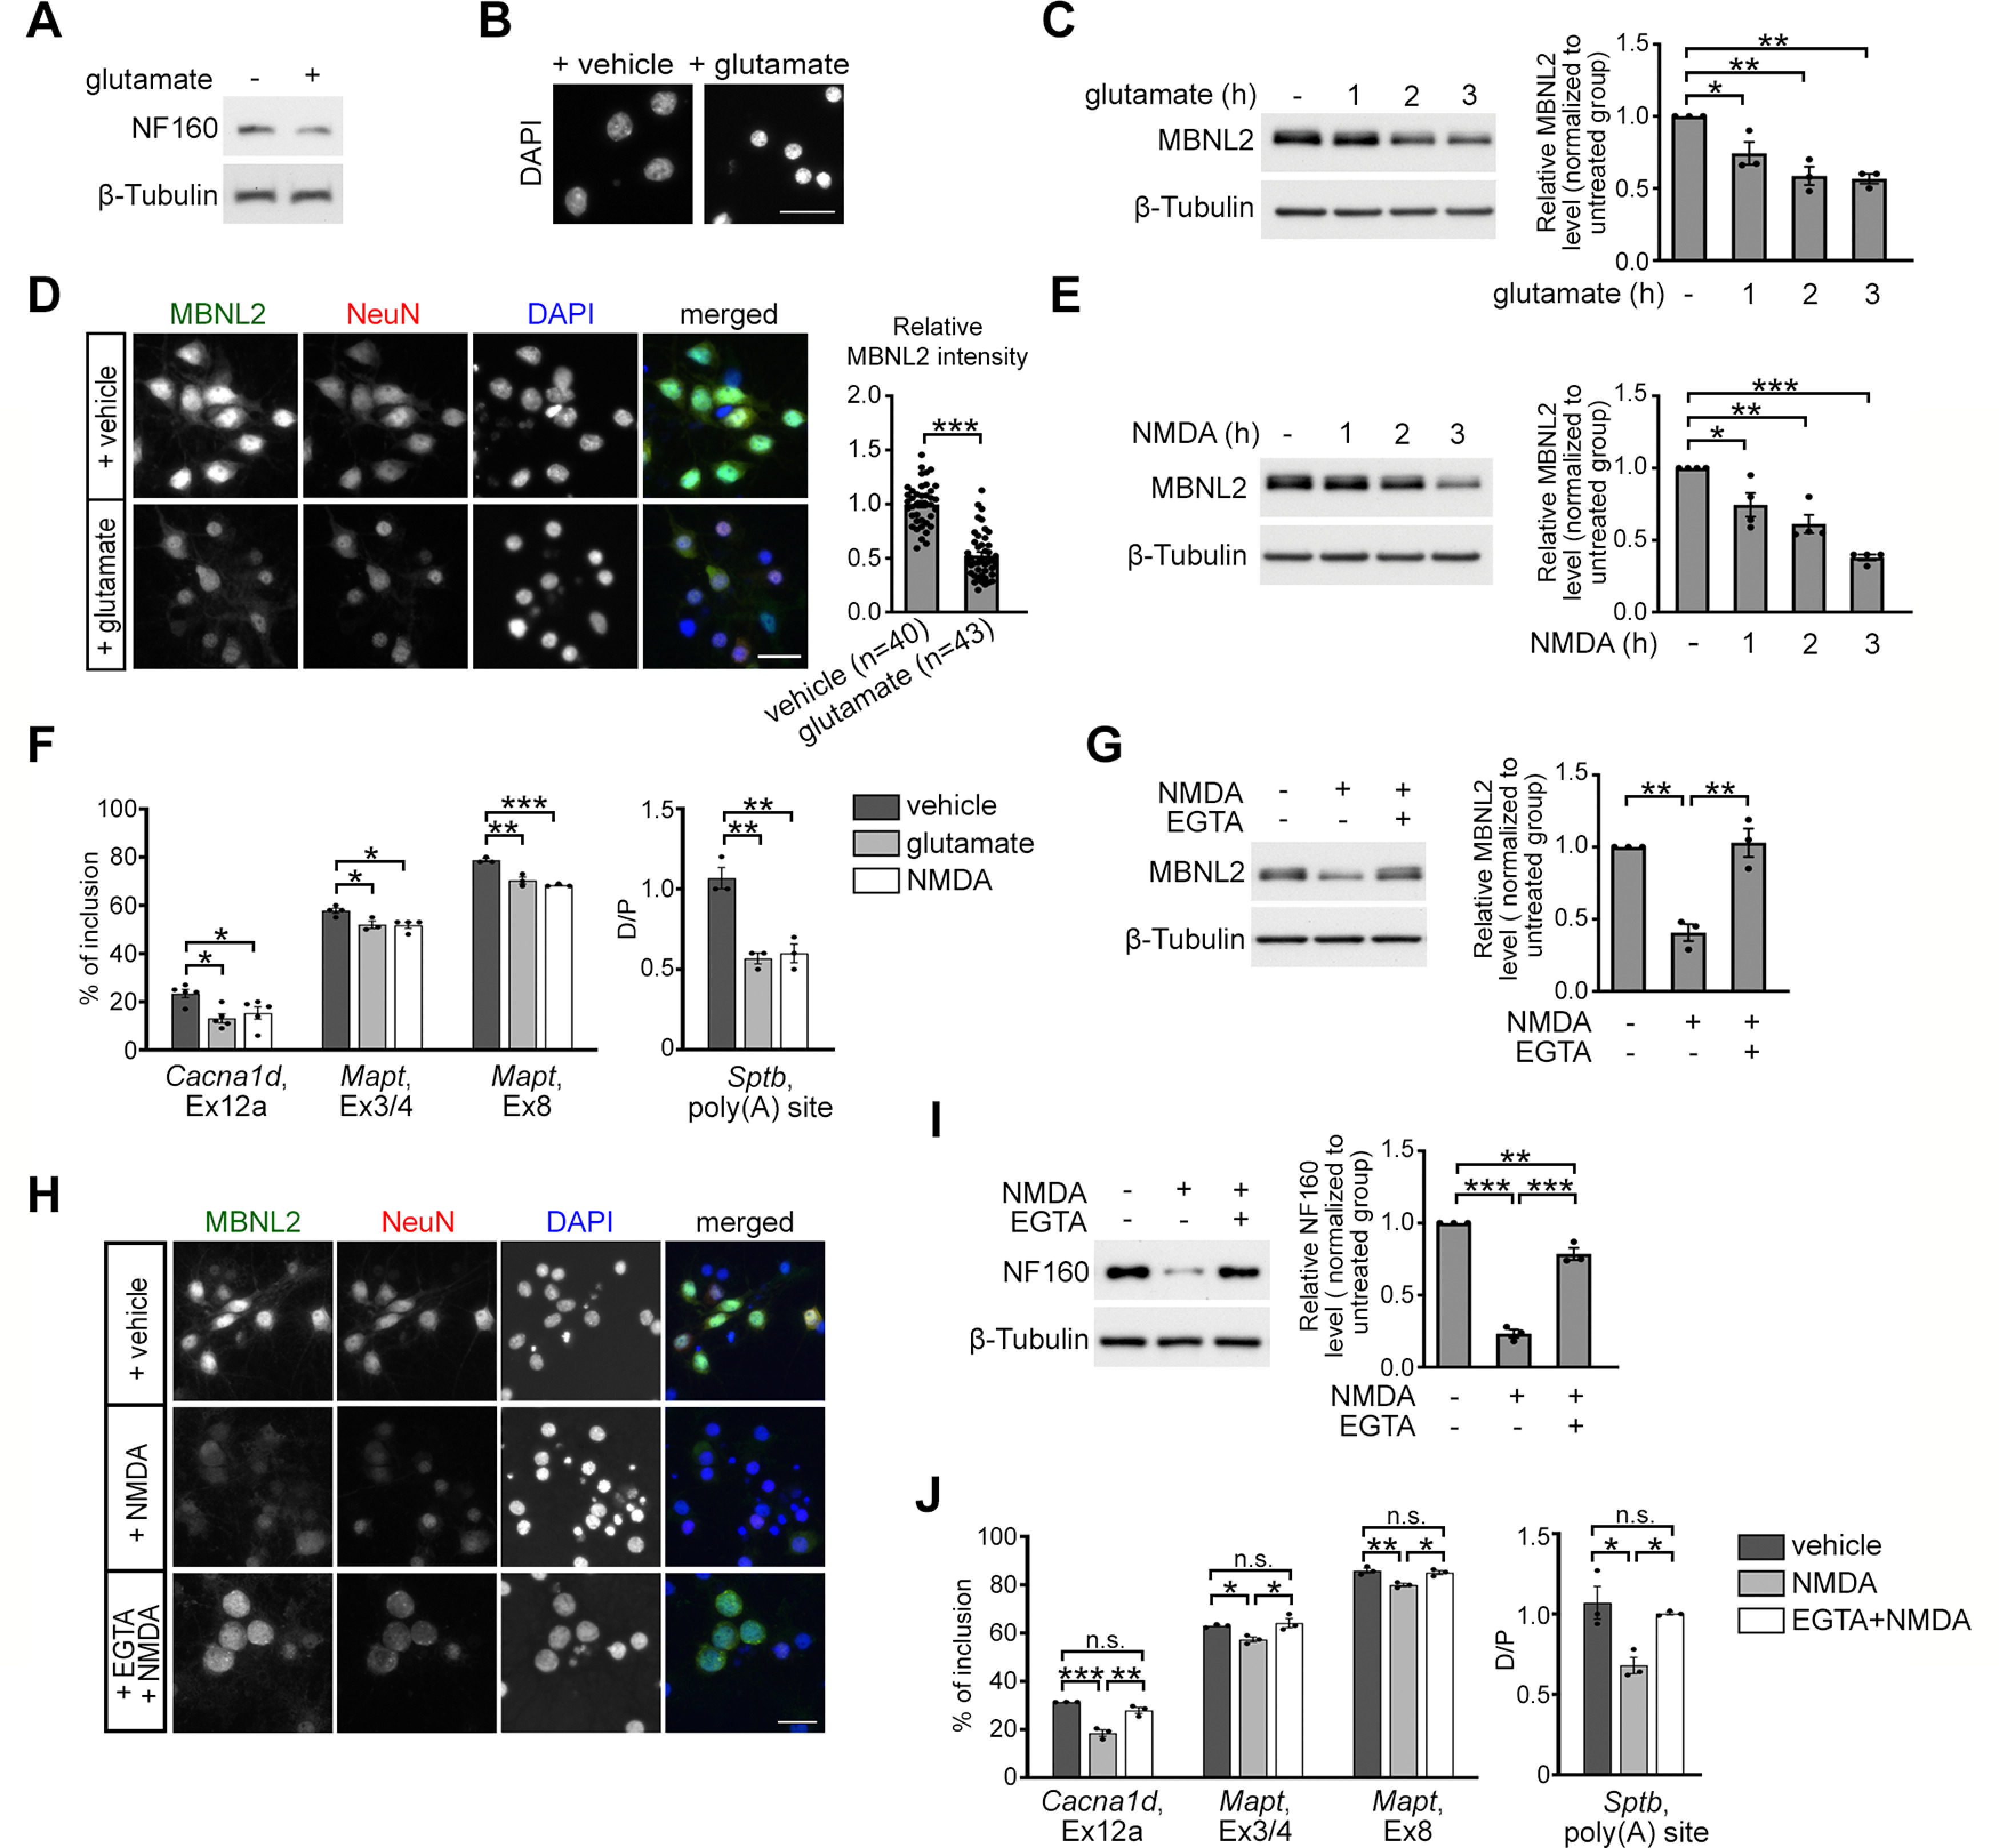
Figure 3.

Glutamate-induced excitotoxicity reduces MBNL2 expression. A, B, Glutamate treatment for 3 h in neurons caused degeneration features including reduced level of NF160 (A) and condensed nuclei (B). C, MBNL2 level was reduced in mature cultured hippocampal neurons treated with glutamate for the indicated times. β-Tubulin was a loading control. Relative amount of MBNL2 for treatments was compared by normalization with β-tubulin (1 h: p = 0.0371; 2 h: p = 0.0026; 3 h: p = 0.0019). D, Representative images of MBNL2 immunoreactivity in neurons treated with vehicle or glutamate. NeuN staining was a neuronal marker. Quantification of overall MBNL2 intensity is shown at the right (p < 0.0001). Number of neurons (n, from 1 cultured neuron preparation) used for quantification is indicated. E, MBNL2 level was reduced in neurons treated with NMDA for the indicated times (1 h: p = 0.0220; 2 h: p = 0.0011; 3 h: p < 0.0001). F, Aberrant MBNL2-regulated RNA processing events in glutamate-treated or NMDA-treated neurons (for Cacna1d, Ex12a, glutamate: p = 0.0119; NMDA: p = 0.0455, for Mapt, Ex3/4, glutamate: p = 0.0323; NMDA: p = 0.0181, for Mapt, Ex8, glutamate: p = 0.0019; NMDA: p = 0.0006, for Sptb, poly(A) site, glutamate: p = 0.0015; NMDA: p = 0.0022). G, Pretreatment with calcium chelator EGTA preserved MBNL2 level in NMDA-treated neurons (NMDA: p = 0.0018; NMDA+EGTA: p = 0.0014). H, Immunofluorescent staining of MBNL2 expression and DAPI used for examining the nuclear morphology in the NeuN+ neurons. I, Effect of EGTA pretreatment on NF160 expression in the NMDA-treated neurons. Relative amount of NF160 was compared by normalization with β-tubulin (untreated vs NMDA: p < 0.0001; NMDA vs NMDA+EGTA: p < 0.0001; untreated vs NMDA+EGTA: p = 0.0052). J, Effect of EGTA pretreatment before NMDA stimulation on the splicing pattern of MBNL2-regulated RNA processing events (for Cacna1d, Ex12a, vehicle vs NMDA: p = 0.0004; NMDA vs NMDA+EGTA: p = 0.0020; vehicle vs NMDA+EGTA: p = 0.1301, for Mapt, Ex3/4, vehicle vs NMDA: p = 0.0433; NMDA vs NMDA+EGTA: p = 0.0204; vehicle vs NMDA+EGTA: p = 0.8062, for Mapt, Ex8, vehicle vs NMDA: p = 0.0055; NMDA vs NMDA+EGTA: p = 0.0109; vehicle vs NMDA+EGTA: p = 0.7879, for Sptb, poly(A) site, vehicle vs NMDA: p = 0.0132; NMDA vs NMDA+EGTA: p = 0.0302; vehicle vs NMDA+EGTA: p = 0.7621). Three to four independent experiments were used for quantification. Data are mean ± SEM; *p < 0.05, **p < 0.01, ***p < 0.001, by one-way ANOVA with Tuckey's test (C, E–G, I, J) or Student t test (D). n.s., not significant. Scale bar: 20 µm (B), 50 µm (D), and 25 µm (H).
