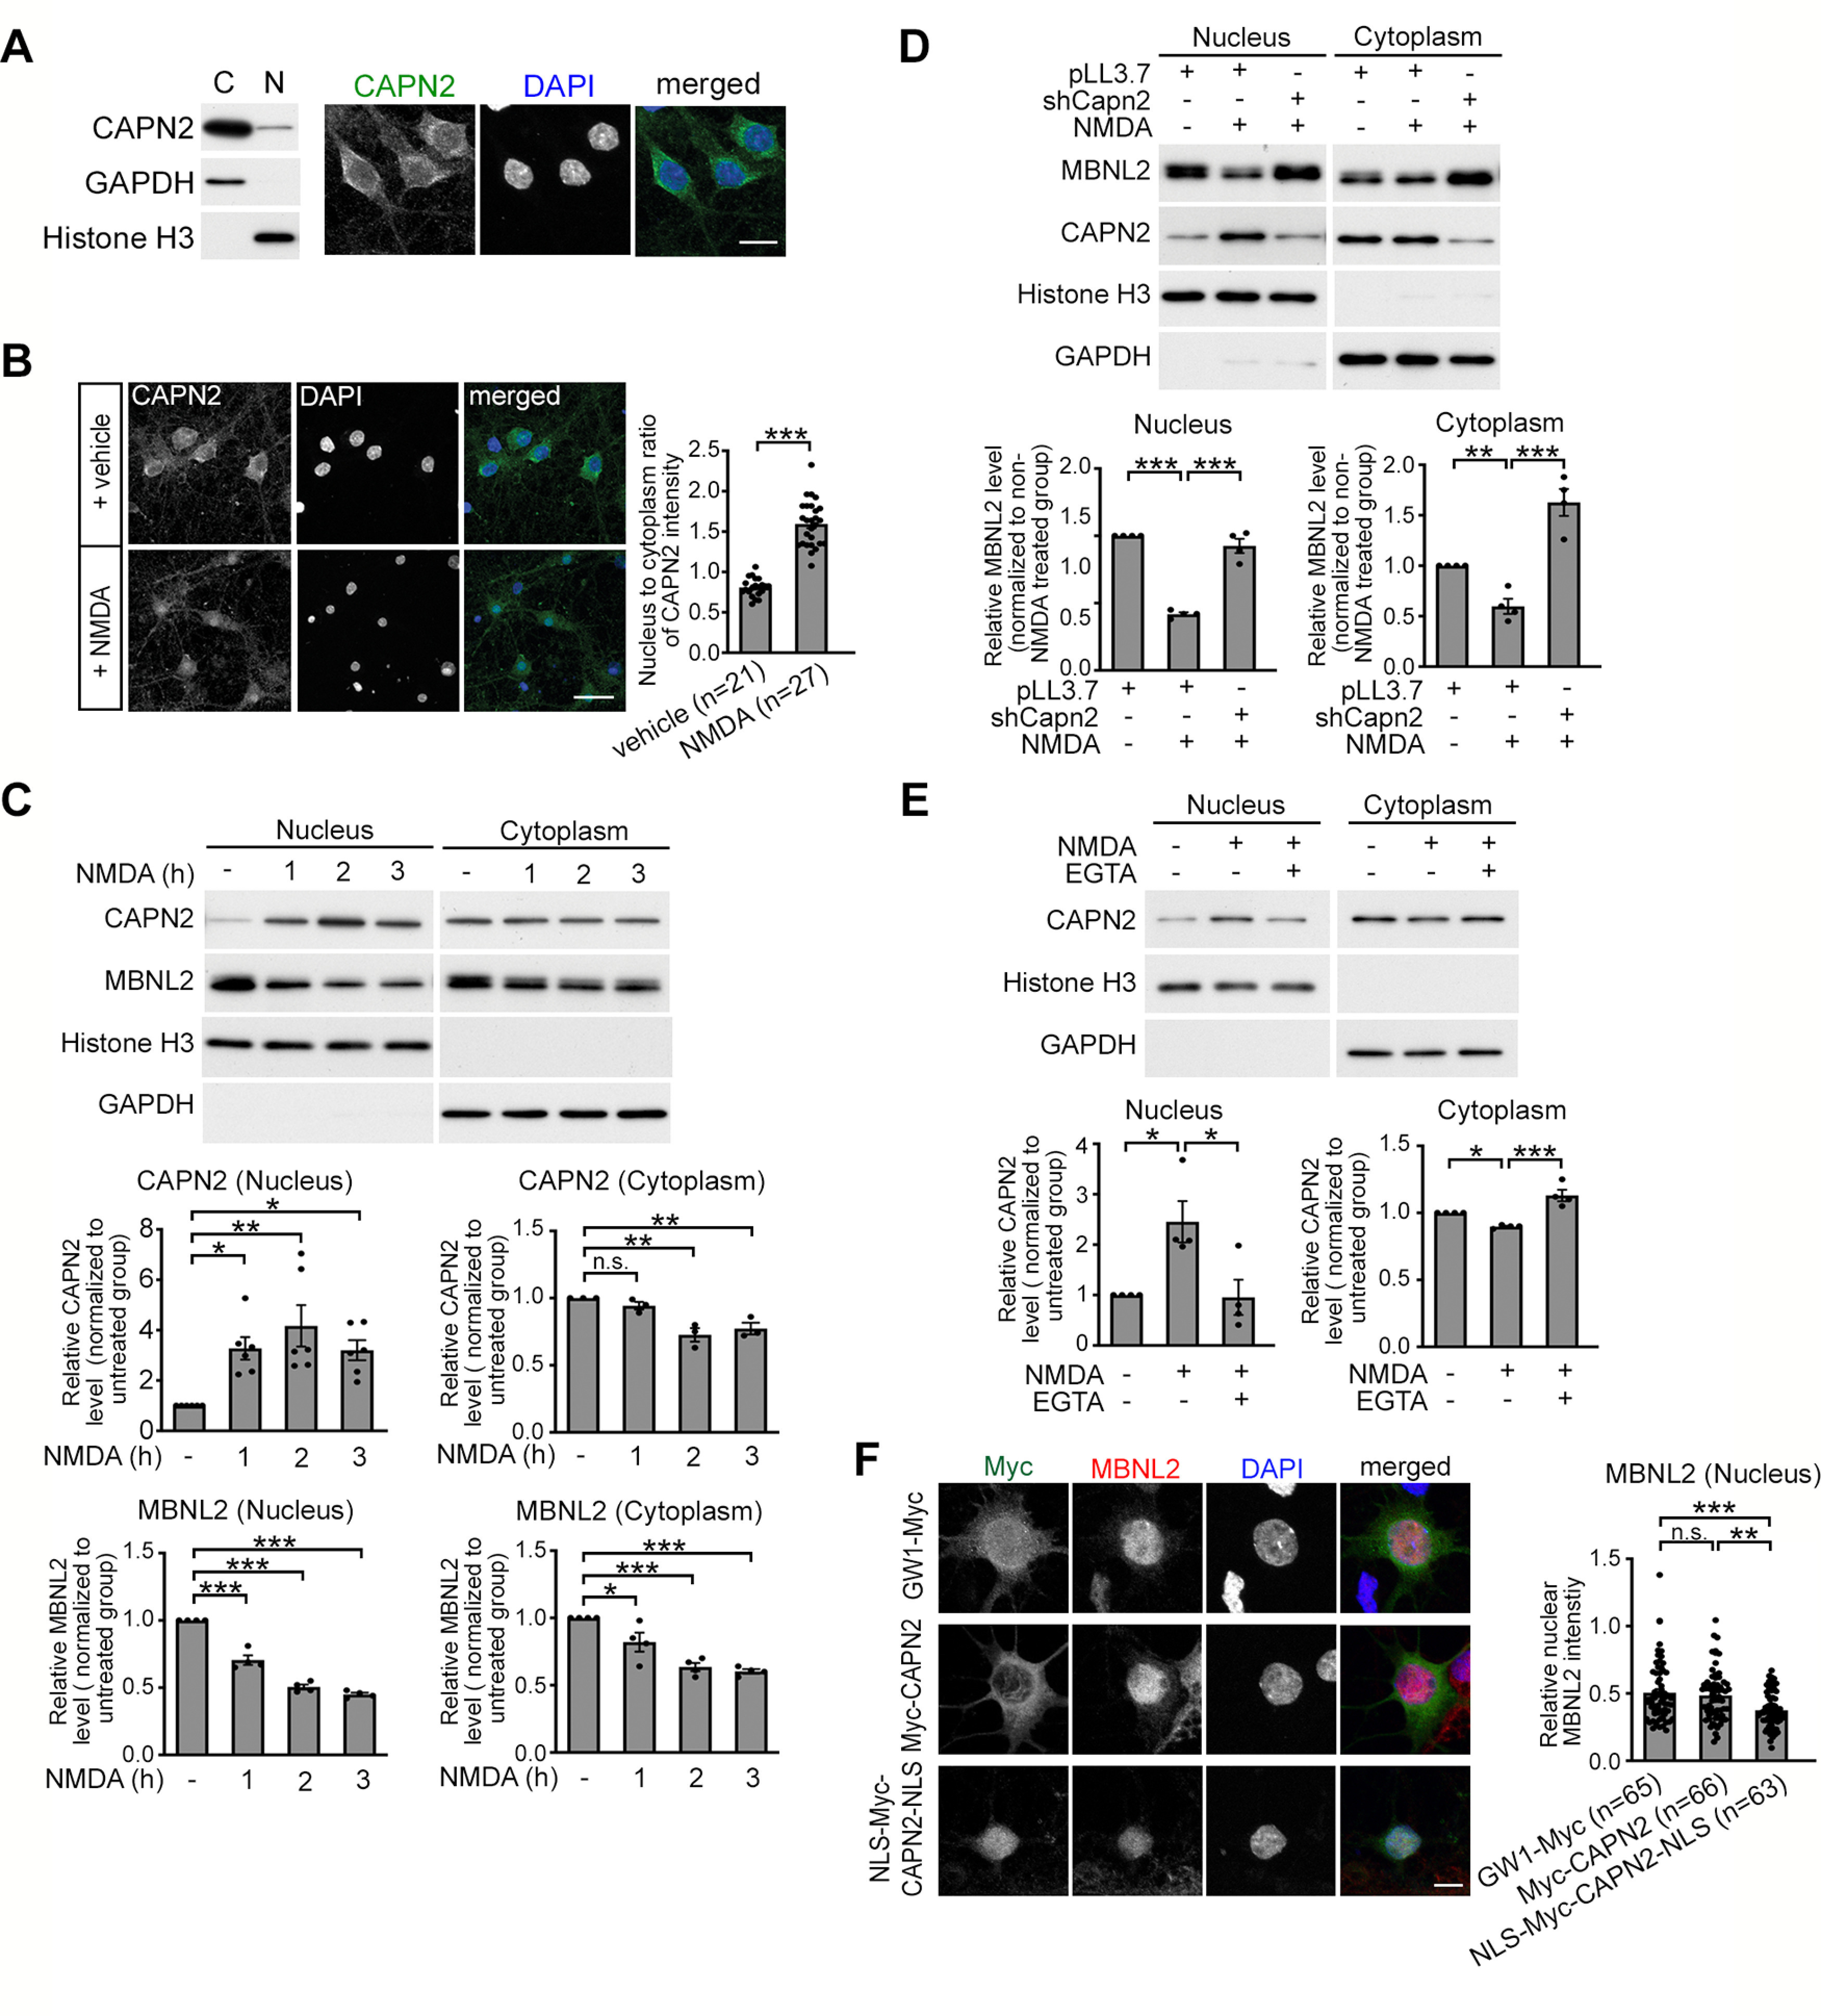
Figure 5.

Nuclear translocation of calpain-2 is calcium-dependent and required for MBNL2 degradation. A, Subcellular distribution of endogenous CAPN2 in mature hippocampal neurons by biochemical fractionation (left) and immunofluorescence staining (right). B, NMDA treatment increased the nuclear fraction of CAPN2. Quantification of nucleus-to-cytoplasm ratio of CAPN2 immunoreactivity at right (p < 0.0001). Number of neurons (n, from 1 cultured neuron preparation) used for quantification is indicated. C, Nuclear and cytoplasmic distribution of CAPN2 and MBNL2 in neurons treated with NMDA for the indicated times (for CAPN2 nucleus, 1 h: p = 0.0233; 2 h: p = 0.0014; 3 h: p = 0.0288, for CAPN2 cytoplasm, 1 h: p = 0.6990; 2 h: p = 0.0032; 3 h: p = 0.0098, for MBNL2 nucleus, p < 0.0001 for all, for MBNL2 cytoplasm, 1 h: p = 0.0311; 2 h: p = 0.0001; 3 h: p < 0.0001). D, CAPN2 knock-down preserved MBNL2 expression in both nuclear and cytoplasmic fractions of NMDA-treated neurons (for nucleus, pLL3.7 vs pLL3.7+NMDA: p < 0.0001; pLL3.7+NMDA vs shCapn2+NMDA: p = 0.0001, for cytoplasm, pLL3.7 vs pLL3.7+NMDA: p = 0.0013; pLL3.7+NMDA vs shCapn2+NMDA: p < 0.0001). E, Pretreatment with EGTA inhibits the nuclear translocation of CAPN2 in NMDA-treated neurons (for nucleus, untreated vs NMDA: p = 0.0225; NMDA vs NMDA+EGTA: p = 0.0192, for cytoplasm, untreated vs NMDA: p = 0.0414; NMDA vs NMDA+EGTA: p = 0.0003). F, Representative images of Myc and MBNL2 immunoreactivity in neurons transfected with GW1-myc (top), Myc-CAPN2 (middle), or NLS-Myc-CAPN2-NLS (bottom). Quantification of intensity of nuclear MBNL2 immunoreactivity in neurons transfected with the indicated constructs was shown at right (GW1-Myc vs Myc-CAPN2: p = 0.8074; Myc-CAPN2 vs NLS-Myc-CAPN2-NLS: p = 0.0027; GW1-Myc vs NLS-Myc-CAPN2-NLS: p = 0.0003). Number of neurons (n, from 3 independent cultured neuron preparations and transfections) used for quantification is indicated. Histone H3 and GAPDH were loading controls for nuclear and cytoplasmic fractions, respectively (A, C–E). Quantification of cytoplasmic and nuclear fractions of CAPN2 and MBNL2 relative to loading controls is shown (C–E). Three to five independent experiments were used for quantification. Data are mean ± SEM; *p < 0.05, **p < 0.01, ***p < 0.001, by one-way ANOVA with Tuckey's test (C–F) or Student t test (B). n.s., not significant. Scale bar: 25 µm (A), 20 µm (B), and 5 µm (F).
