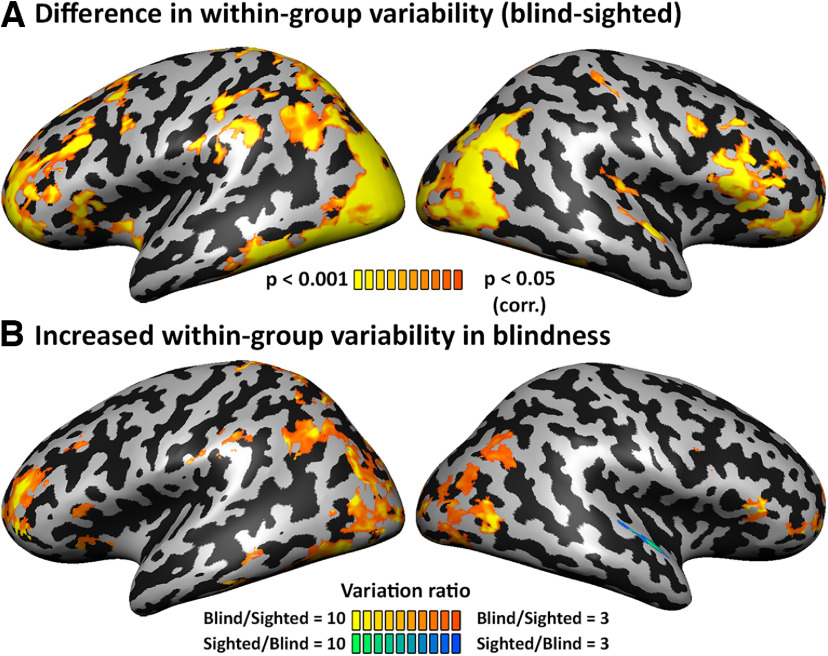
Figure 1.
Variability in brain connectivity is increased in blindness. A, The difference in within-group variability between the groups is significant in various parts of the brain, including in the frontal lobe. B, Directional comparison of the within-group variability difference (ratio of blind intragroup variability divided by sighted intragroup variability >3) shows that the blind have increased variability in most of the regions differing in their variation between the groups. This suggests a stabilizing effect of visual experience on visual cortex developmental functional connectivity. Extended Data Figure 1-1 shows a replication of the results with global signal regression. Extended Data Figure 1-2 shows a replication of the results when controlling for the increased mean RSFC in blindness and for V1 cortical thickness. When controlling for increased mean V1-RSFC in blindness, the variability difference between the groups is even more robust and covers larger portions of cortex (A). Importantly, almost all the variability difference shows increased variability in blindness (B), supporting the conclusion that individual differences increase in blindness. Extended Data Figure 1-3 shows comparable analyses for association visual cortex Brodmann areas 18 and 19.

