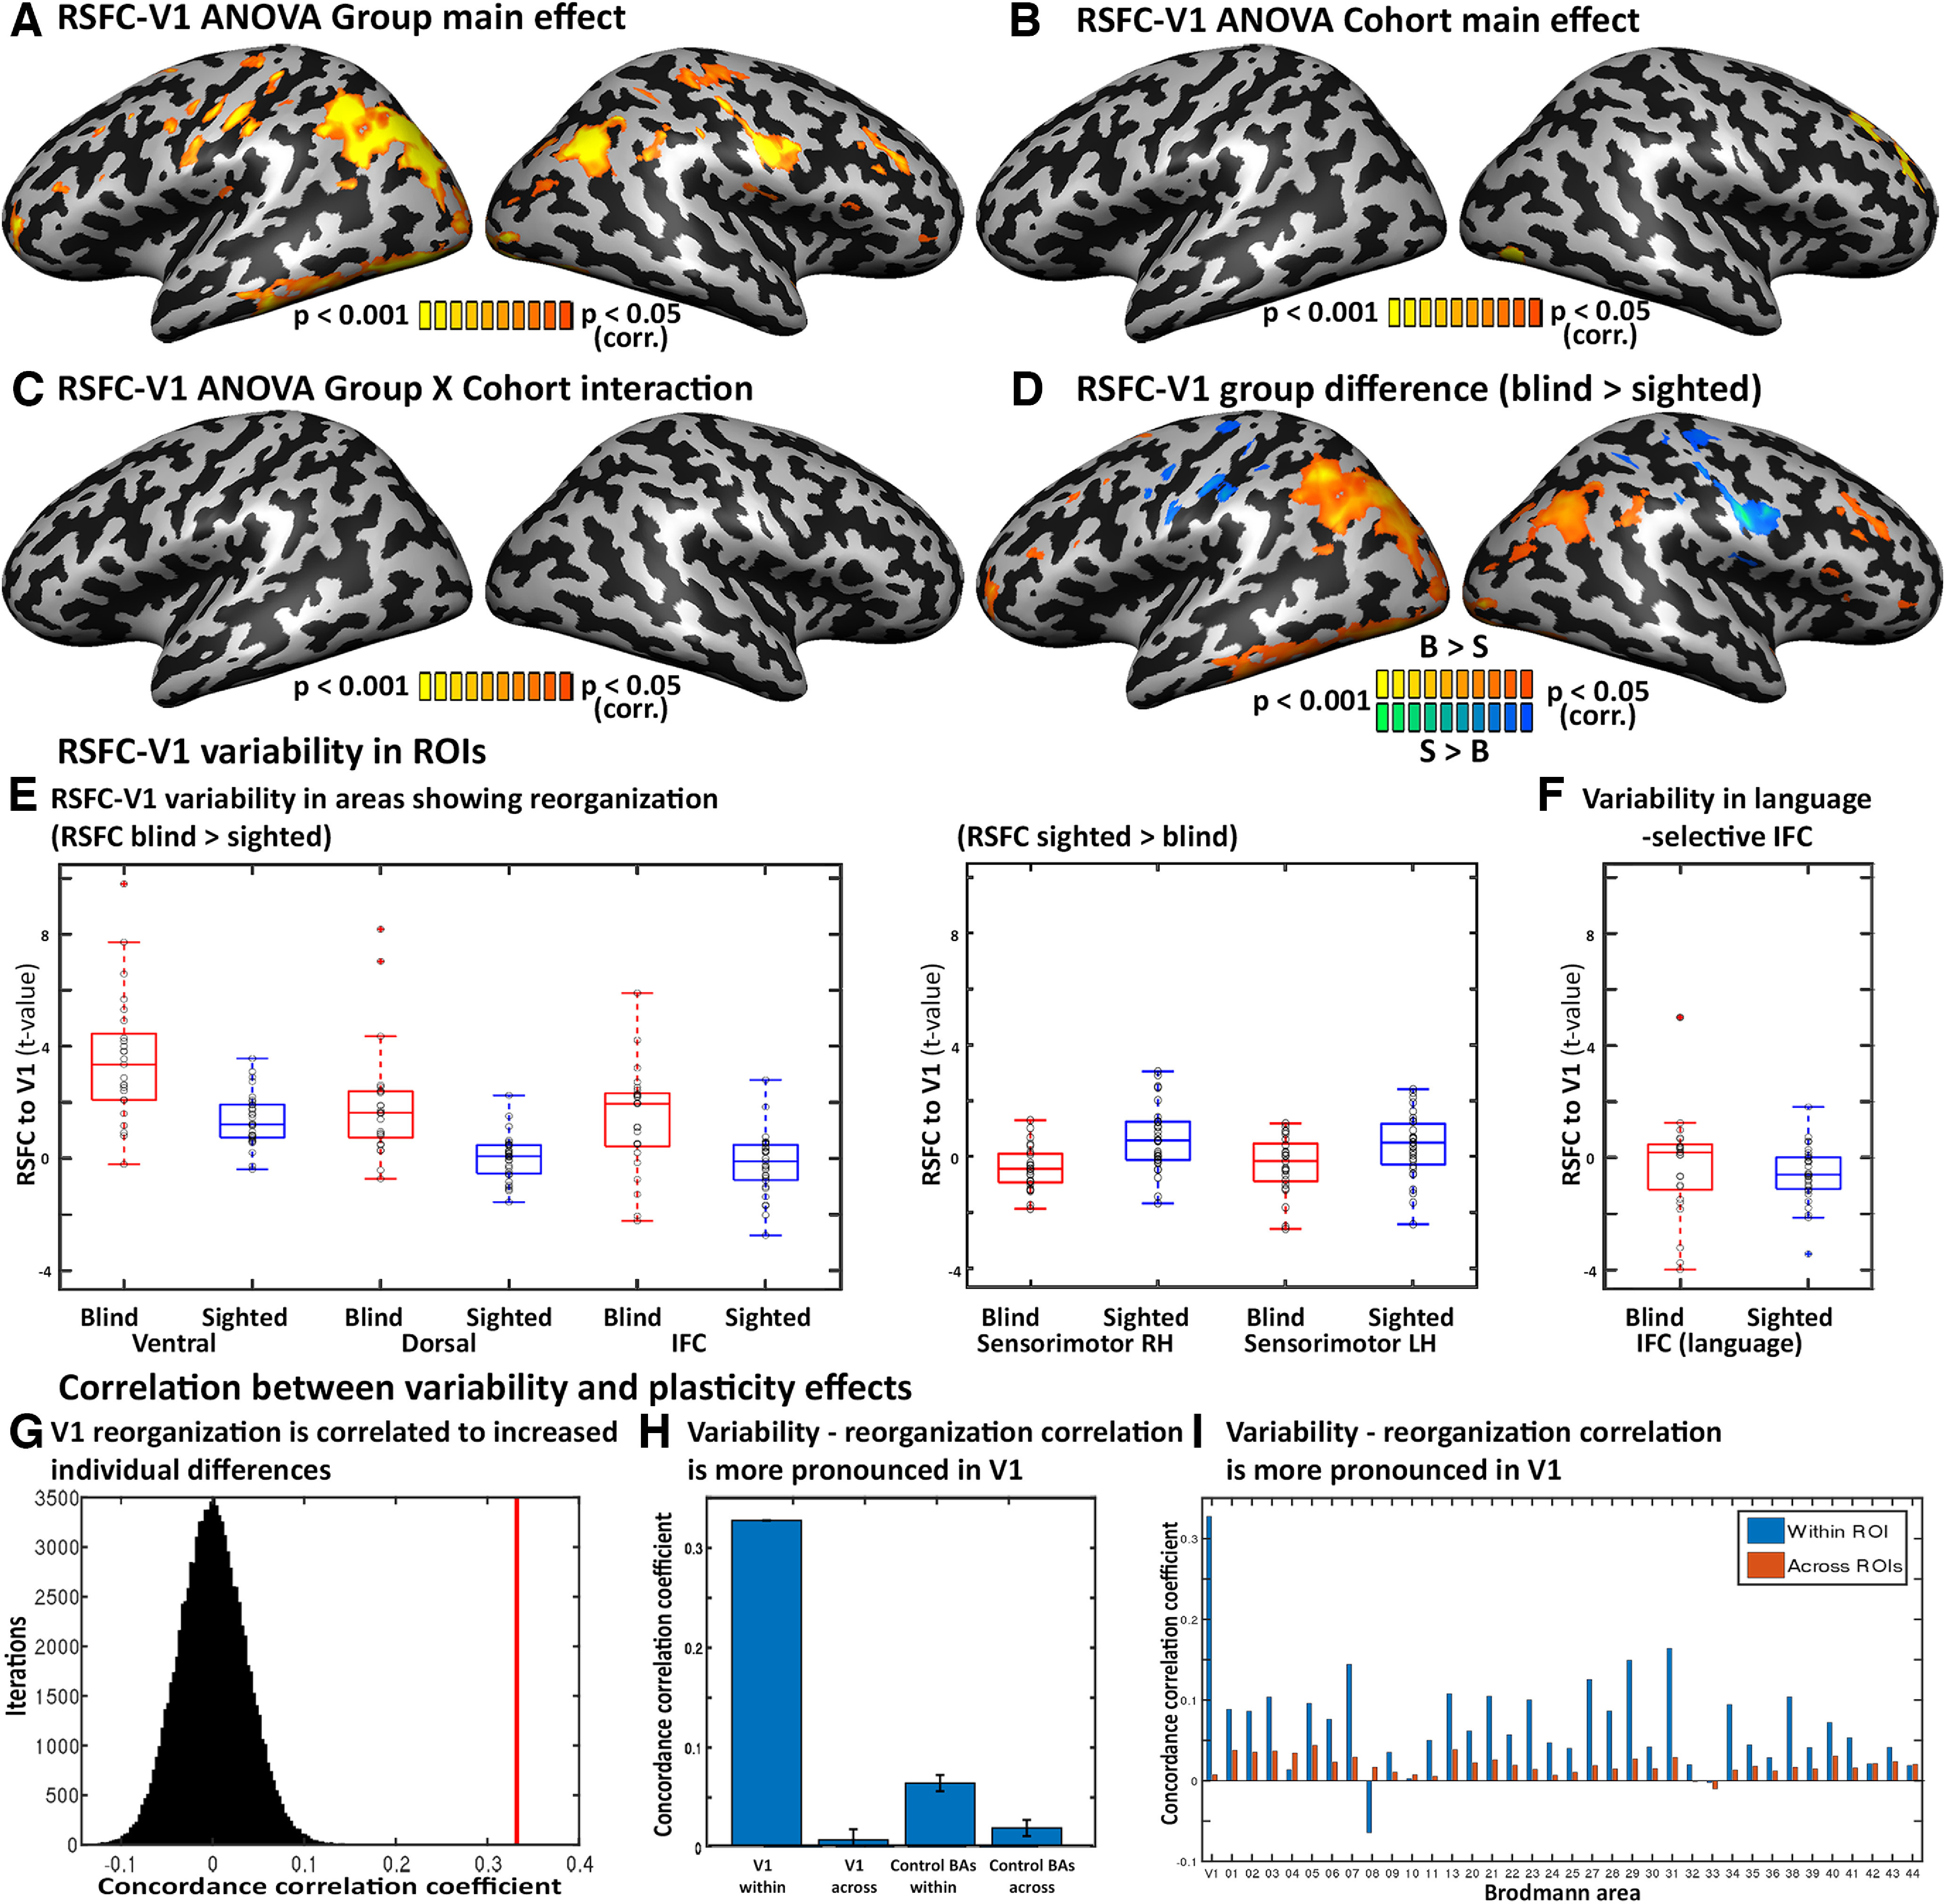
Figure 2.

Brain reorganization in blindness is associated with increased interindividual variability. A-C, Main effects and interactions for the Group X Cohort ANOVA for V1-RSFC. A, The effect of sight across the cohorts is depicted. As reported before, the blind and sighted differed in their RSFC from the primary visual cortex to visual, parietal, and frontal regions. B, The main effect of cohort across the groups, showing little difference focused in the right superior frontal cortex. C, The Group X Cohort interaction shows no significant effect. D, Increased V1-seeded RSFC in blindness is found in the visual streams, as well as in the bilateral IFC. E, F, The blind show increased variability in their V1-seeded RSFC to left ventral stream, dorsal stream, and IFC frontal areas. Box plots are presented for the blind and sighted in red and blue, respectively. The central mark indicates the median, and the bottom and top edges of the box indicate the 25th and 75th percentiles, respectively. Error bars represent the standard deviation. Individual participant data are presented in circles. E, Within the areas showing increased RSFC in the blind (Fig. 2D). The sensorimotor cortex, showing decreased V1-RSFC in blindness, showed similar but slightly lower variability in the blind. F, The blind show increased variability in their V1-seeded RSFC to a language-selective IFC ROI, defined by preference toward words compared with pseudowords. G, Overall across the brain, areas showing changes in RSFC in blindness also show increased variability across blind participants. The concordance correlation coefficient was calculated between the RSFC group difference and RSFC change in variability for the V1 seed (red line) and compared with a spatial permutation test (distribution in black). H, The link between reorganization and increased variability in blindness is more pronounced in V1. Correlation between the two maps for the V1 seed was significantly greater than in correlating across seeds and significantly greater for V1 compared with other nonvisual Brodmann areas. Error bars represent the standard deviation. I, The link between reorganization and increased variability in blindness is presented for V1 (bar, far left) and all control nonvisual Brodmann areas in blue. For each area, the across-seed correlation is shown in red. The within-seed correlation for all control areas was lower than for V1; however, the comparison between within- and across-seed correlation was significant, suggesting that more broadly, reorganization manifests in greater variability.
