Figure 3.
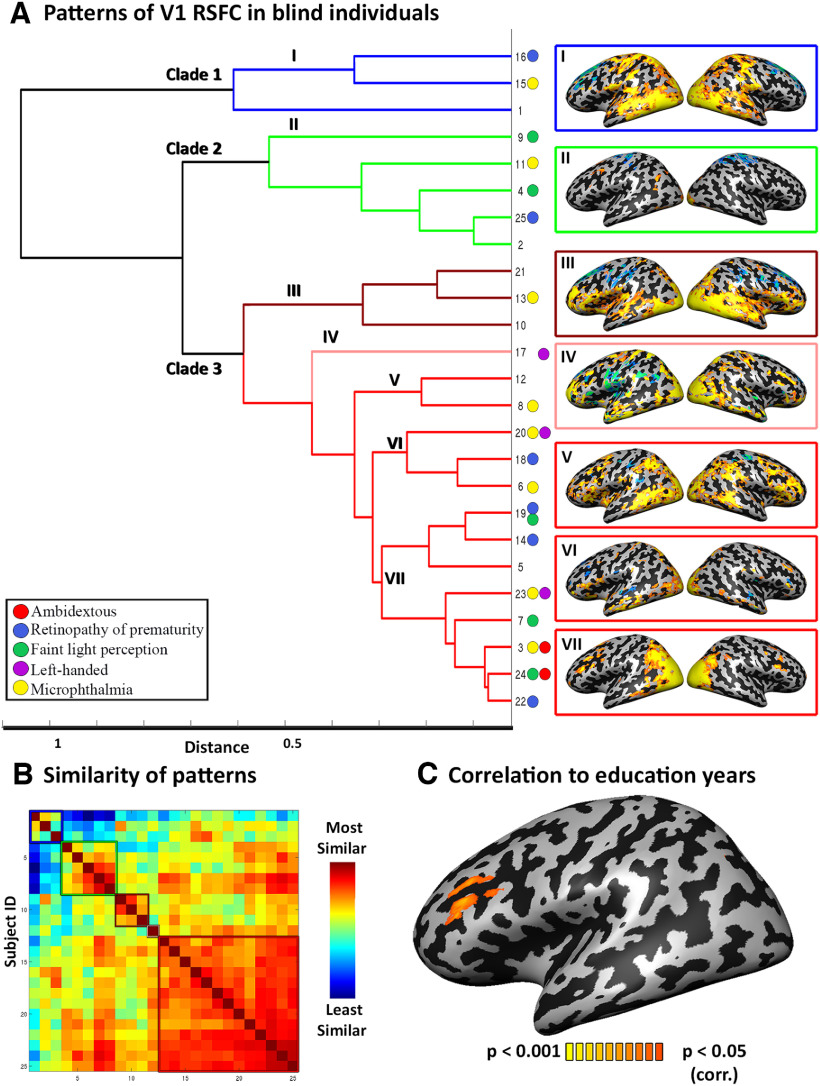
Patterns of brain reorganization in blindness. A, V1-RSFC of each individual blind participant to each Brodmann area was used to compute hierarchical clustering of RSFC patterns across the blind. Three main clades emerge, with differential connectivity to sensorimotor and frontal cortices. Subclades are marked with Roman numerals, and an average V1-RSFC map for the individuals in each subclade is shown. Color circles by participant numbers indicate frequent blindness etiologies (Retinopathy of prematurity - ROP, blue; microphthalmia, yellow) and unique behavioral traits (ambidextrous individuals, red; left-handedness, purple; and faint light perception as opposed to no light perception, green). Hierarchical clustering in the blind does not support linking blindness etiology or crude light perception to the similarity in V1 RSFC profile. With the exception of the two ambidextrous individuals being clustered together, no other qualitative pattern is evident linking blindness etiology or light perception to the similarity in V1 RSFC profiles. Participants 13 and 20, found on different subclades, are siblings who are blind because of genetic microphthalmia. Extended Data Figure 3-1 shows comparable hierarchical clustering in the sighted group, showing lower distances than in the blind. B, The V1-RSFC correlation (similarity) structure between individuals based on which hierarchical clustering analysis was conducted. C, V1-RSFC to the left inferior frontal cortex in the blind (and not in the sighted) is correlated to the duration of formal education, showing one environmental factor affecting individual differences in brain reorganization in blindness.

