Figure 1.

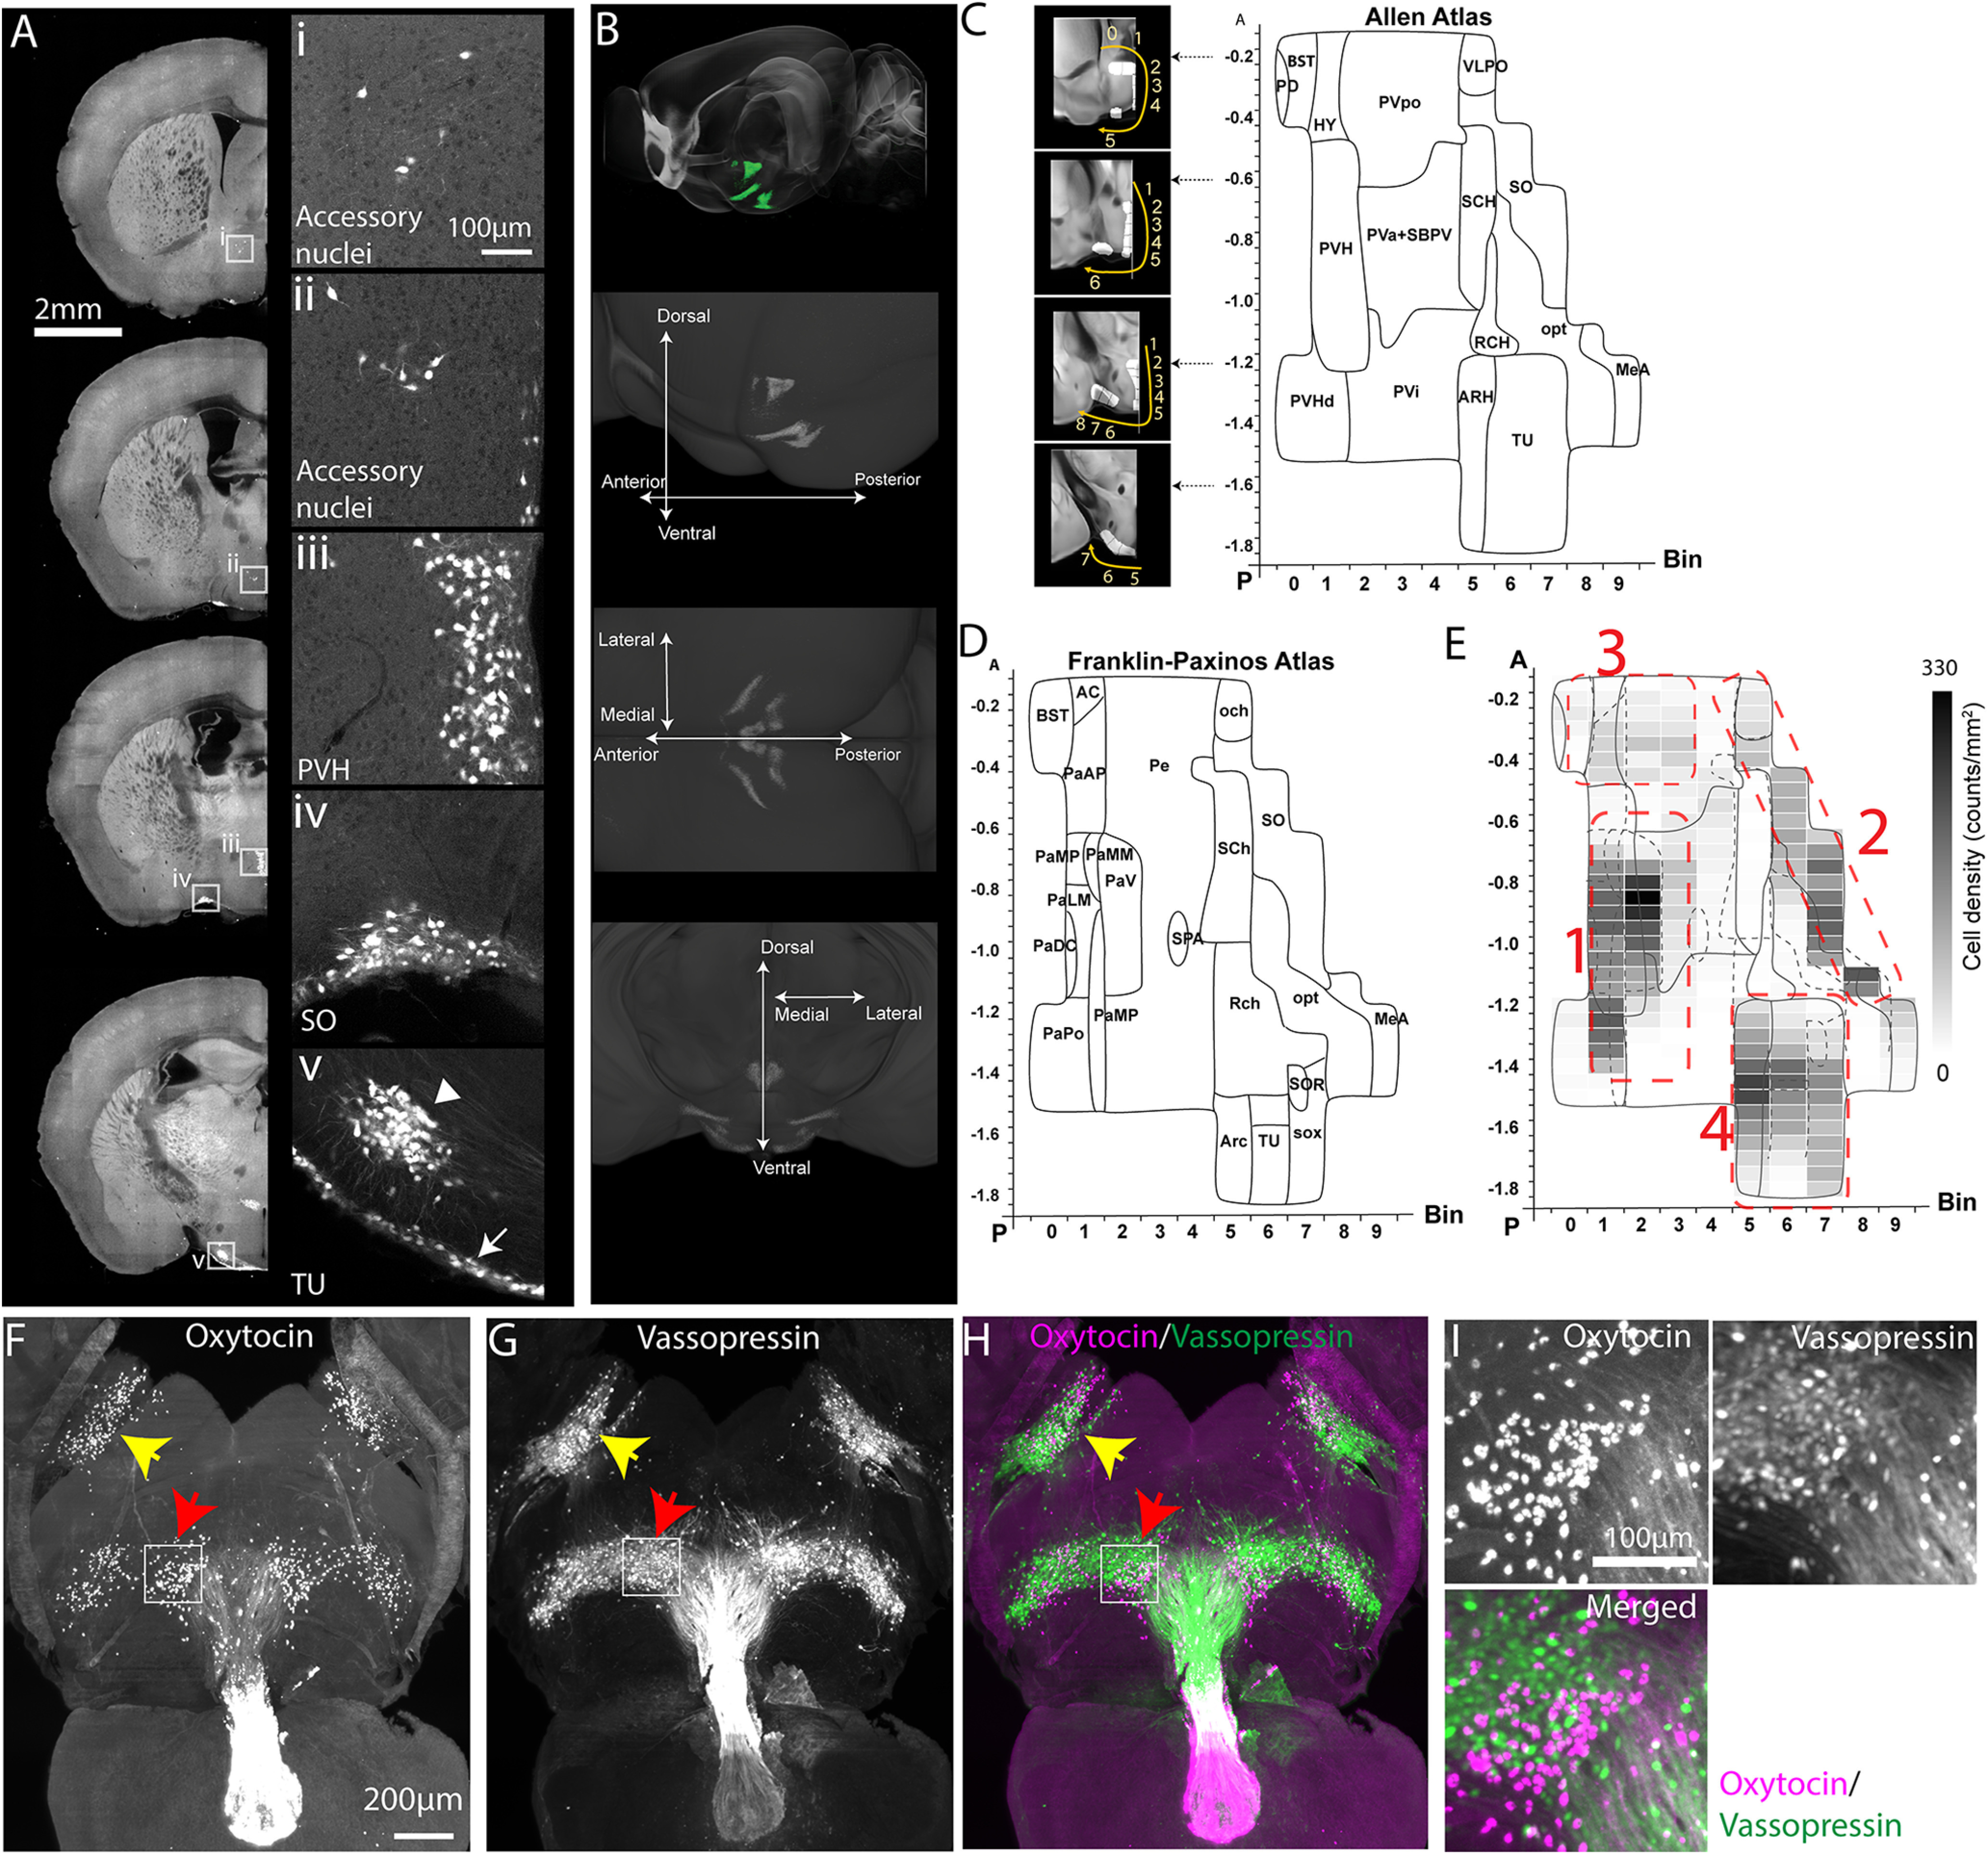
Distribution of Oxt neurons. A, Signals from Oxt-Cre;Ai14 mice across representative coronal planes of the mouse brain. Figures on the right column are high-magnification images from white boxed areas in the left column. The TU (in v panel) contains two subpopulations of Oxt neurons with a small cluster (arrowhead) and a thin layer along the bottom edge of the brain (arrow). Please see Extended Data Figure 1-1 for Oxt antibody validation of Oxt-Cre;Ai14 mice. B, Top, STPT images registered onto the Allen CCF reference brain. Green signals represent averaged Oxt neurons from 8 animals. (bottom) 3D distribution of Oxt neurons. See also Movie 1, Table 1, and Extended Data Table 1-1. C, D, 2D hypothalamic flatmaps. Small insets with coronal sections illustrate how bins (while areas with numbers) were generated at different coronal planes. Anatomical labels in the flatmap are delineated based on Allen mouse brain atlas (C) and Franklin–Paxinos atlas (D). The x-axis is for bin numbers and y-axis is for the bregma A/P axis. The full name of abbreviations can be found in Table 1. E, Heatmap of Oxt neuronal density in four clusters with the overlay of Allen and Franklin–Paxinos labels in solid and dotted lines, respectively. Red dotted lines for four Oxt-expressing domains. 1: PVH, 2: SO, 3: AN, and 4: TU. F–I, LSFM imaging of whole-brain immunostaining with Oxt and vasopressin antibodies; 500-µm-thick z maximum projection of Oxt (F), vasopressin (G), and both (H). Yellow and red arrows for the SO and the TU, respectively. I, High-magnification images from the white boxed TU area in F, G. Note the lack of colocalization between the Oxt and vasopressin.
