
Figure 4.
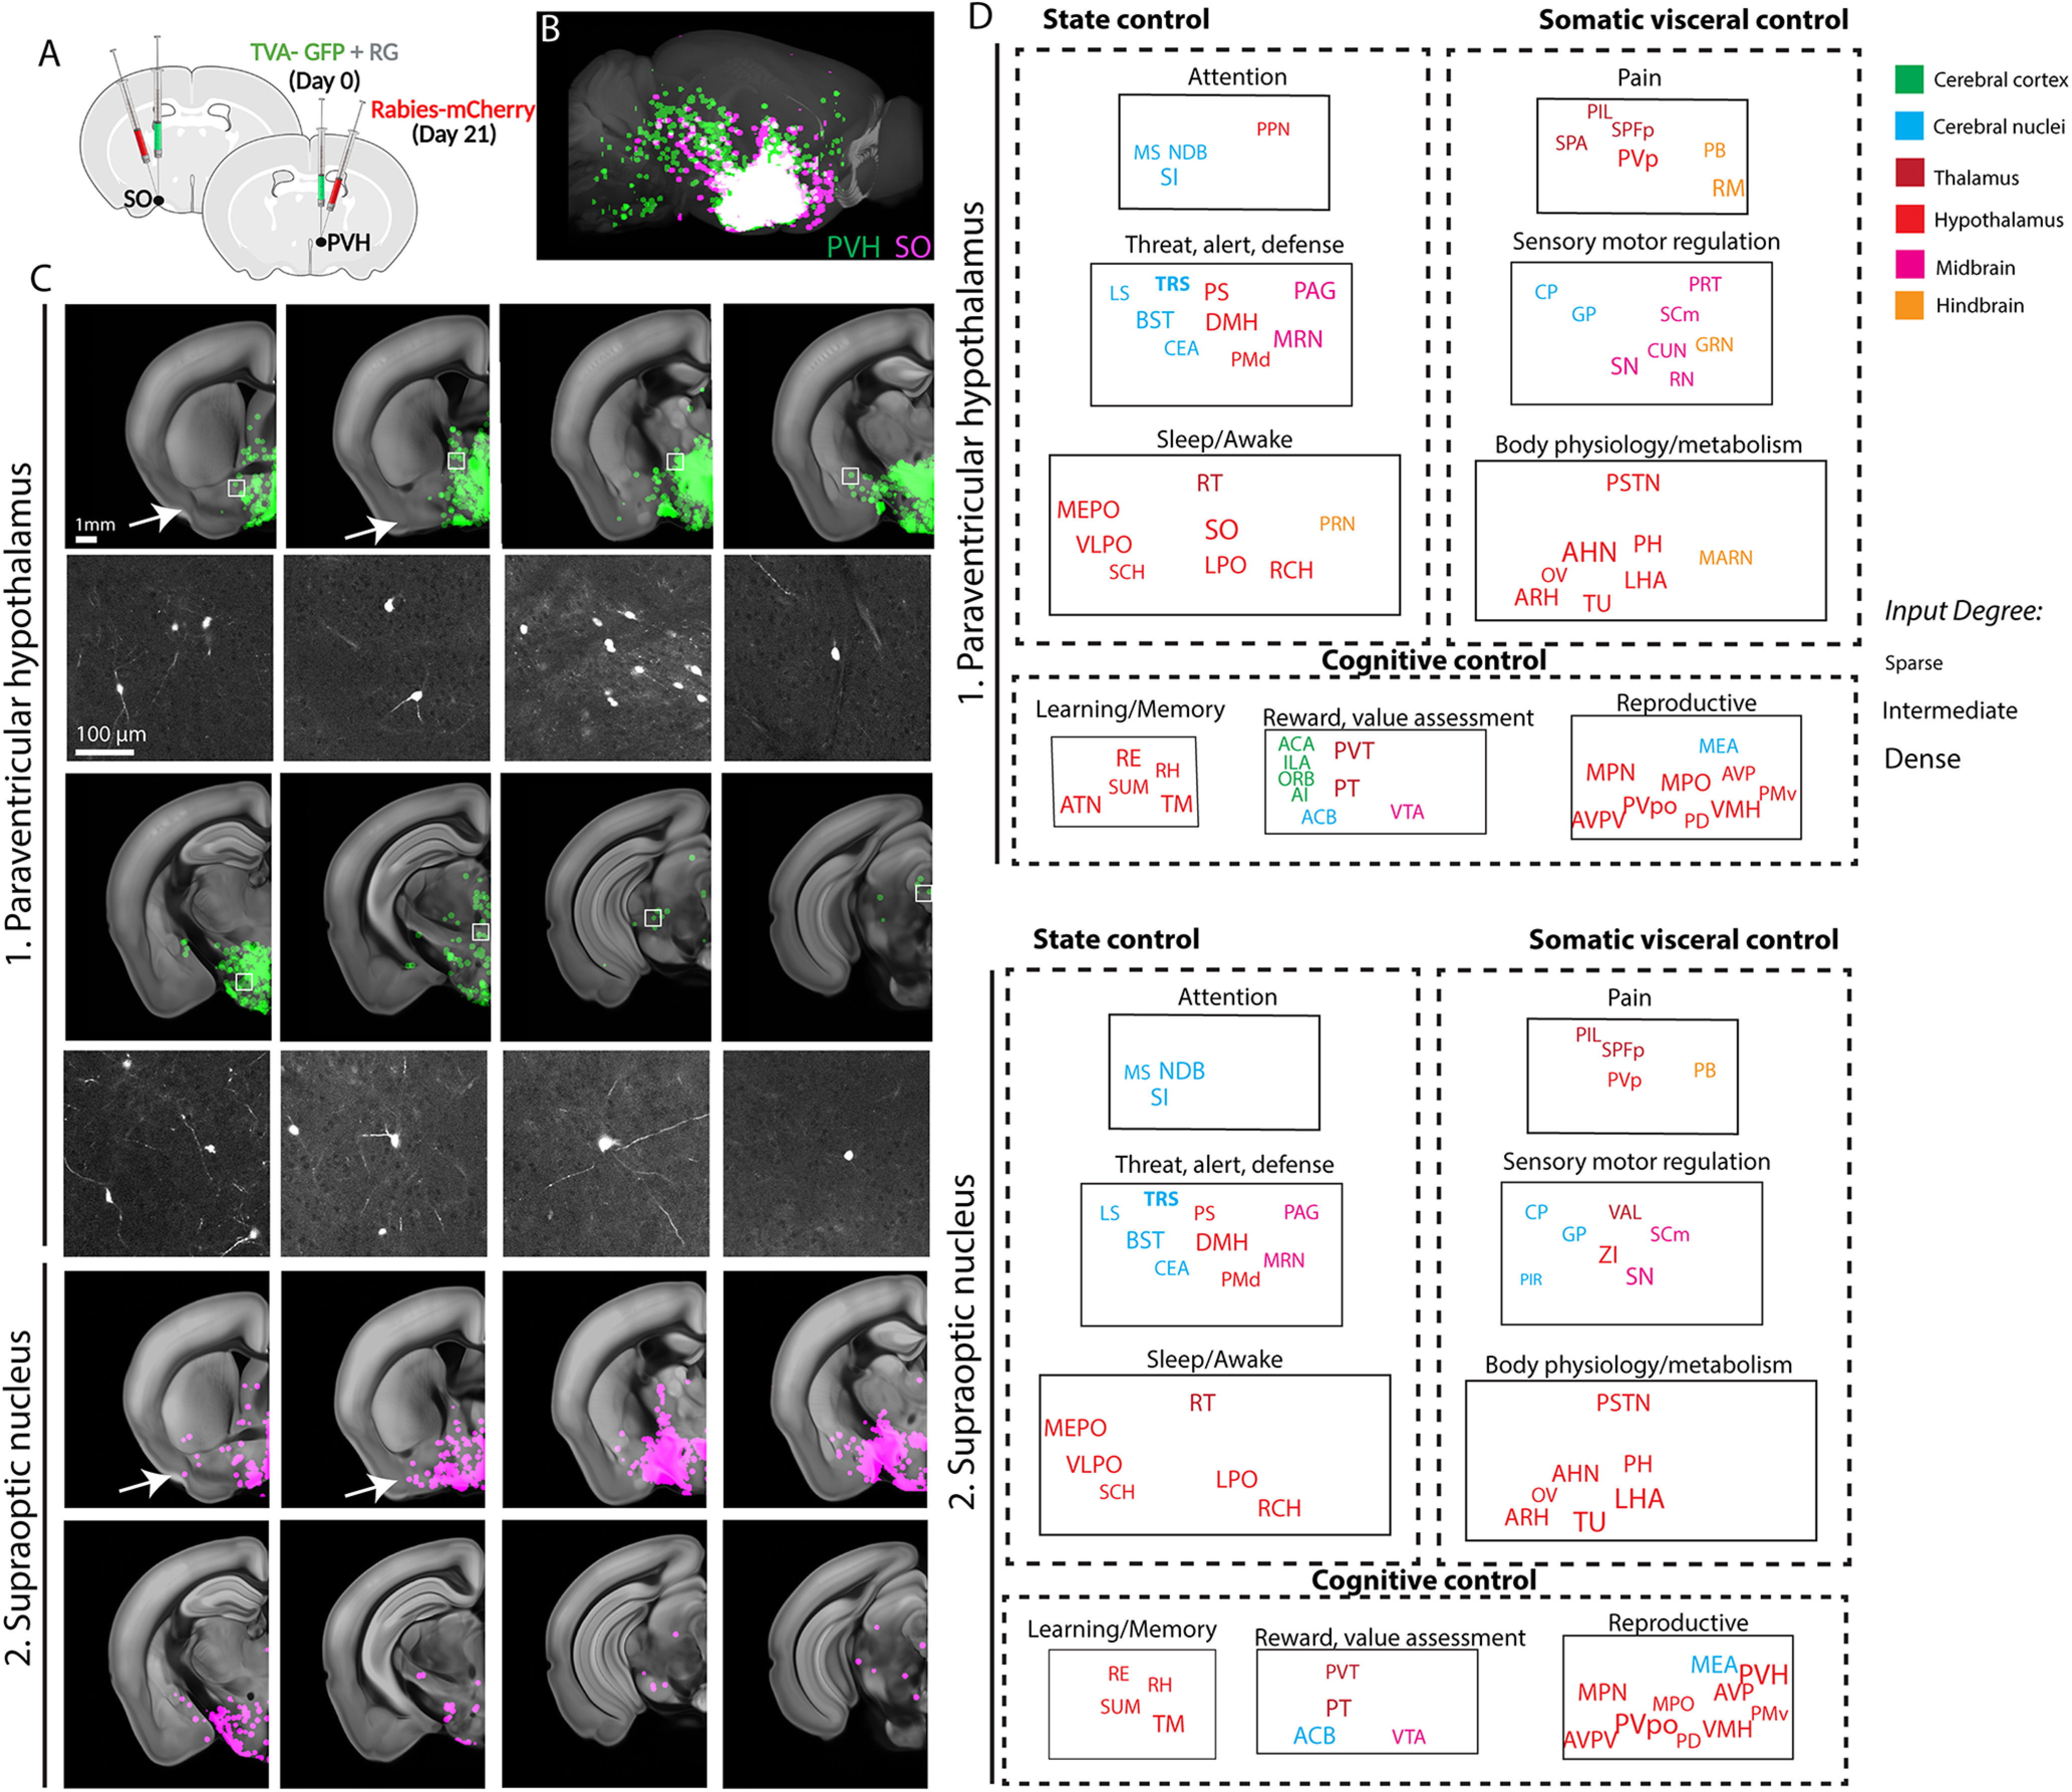
Monosynaptic input map of Oxt neurons in the PVH and the SO. A, Conditional monosynaptic tracing rabies virus was injected in the PVH or the SO of the Oxt-Cre mice. See Extended Data Figures 4-1 and 4-2 for control experiments to support cell type specificity of the rabies tracing. B, Brain-wide inputs into the PVH (green, n = 6 animals) and SO (red, n = 4 animals) Oxt neurons. The maximum signals of all samples from each anatomic region were overlaid on the reference brain. See also Movie 4. C, Representative monosynaptic inputs in different coronal planes (top panel) and high mag images from white boxed areas (bottom panel). Arrows highlight input from lateral brain areas for the SO compared with the PVH. D, Nine functional circuits that provide monosynaptic input to Oxt neurons in the two anatomic areas. Note overall similar input patterns for both areas. The full name of abbreviations can be found in Table 2.