
Fig. 2.
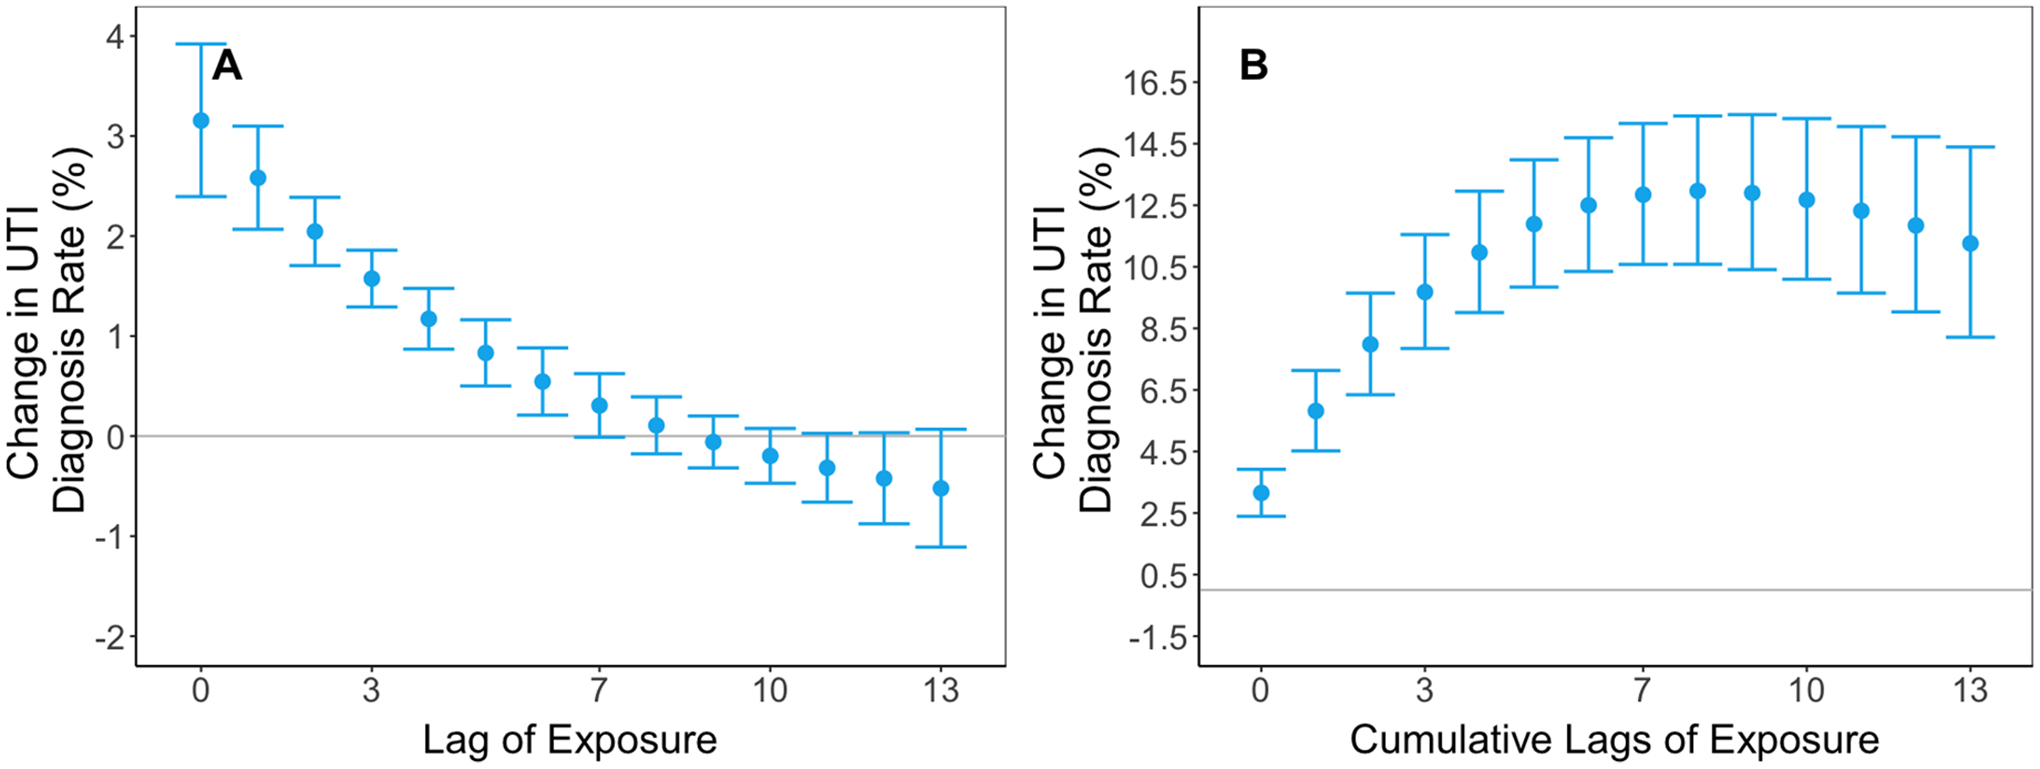
Lag-response effect estimates. Panel A illustrates the percent change in daily UTI diagnosis rate for an increase in temperature from the 5th percentile to the mean for each lag. We fit conditional quasi-Poisson models adjusting for 14-day relative humidity. We constrained the exposure–response to a natural spline with four degrees of freedom and we constrained the lag-response to a natural spline with three degrees of freedom. Panel B illustrates the cumulative association for the same temperature change. Error bars represent 95% confidence intervals.