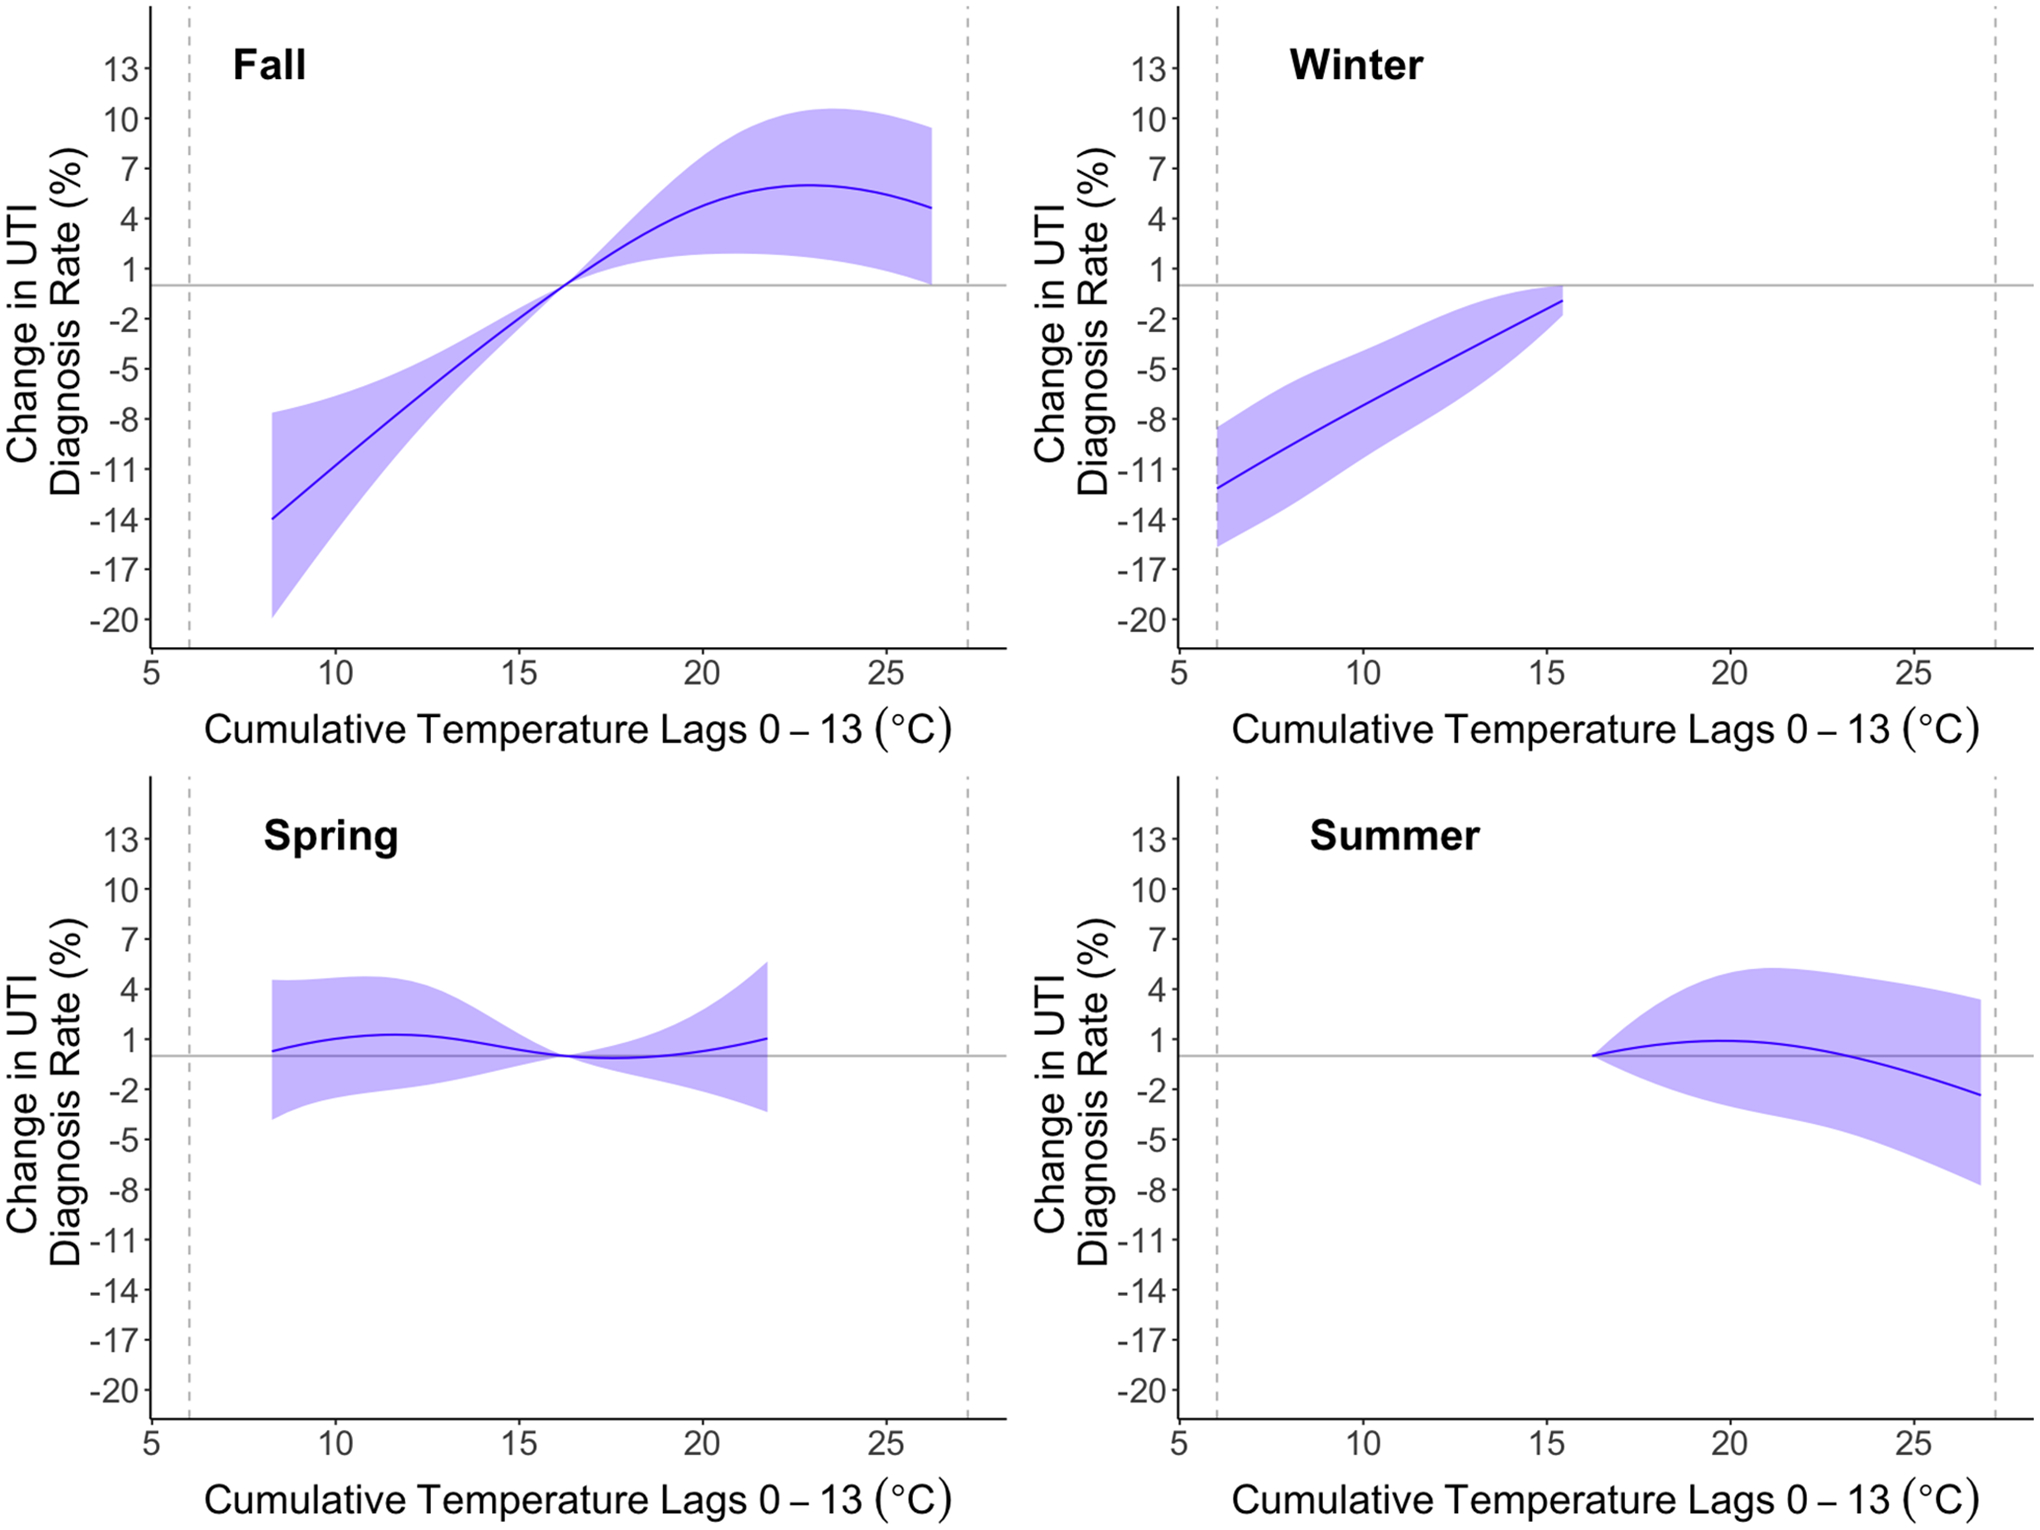
Fig. 3.

Season-stratified exposure–response relationship for 14-day cumulative association between temperature and UTI risk relative to the mean (16.4°C). We fit conditional quasi-Poisson models adjusting for 14-day relative humidity. We constrained the exposure–response to a natural spline with four degrees of freedom and we constrained the lag-response to a natural spline with three degrees of freedom. For each season, we restricted the temperature range to the 5th to 95th percentile of observed temperature for that season. Shaded areas represent 95% confidence intervals.
