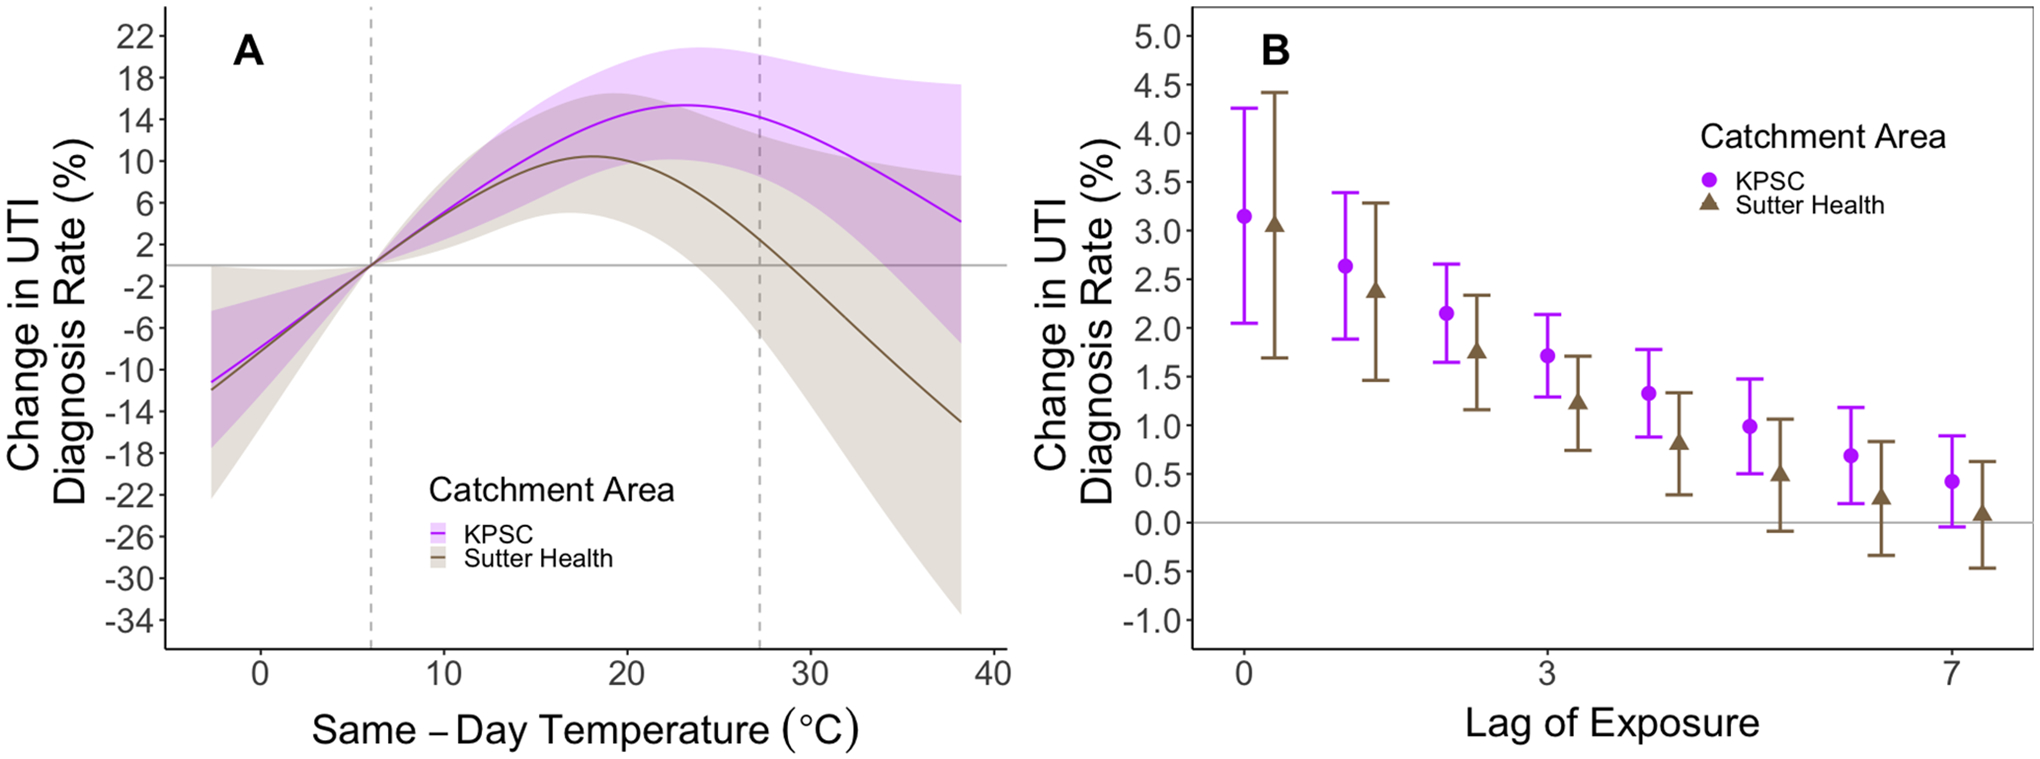
Fig. 4.

Stratified analysis of exposure–response relationship for UTI diagnosis for KPSC and Sutter Health. Panel A depicts the exposure–response relationship for 14-day cumulative temperatures separately for each catchment area and Panel B depicts the associations for same-day through seven-day lags. We constrained the exposure–response to a natural spline with four degrees of freedom and we constrained the lag-response to a natural spline with three degrees of freedom. Shaded areas and error bars represent 95% confidence intervals.
