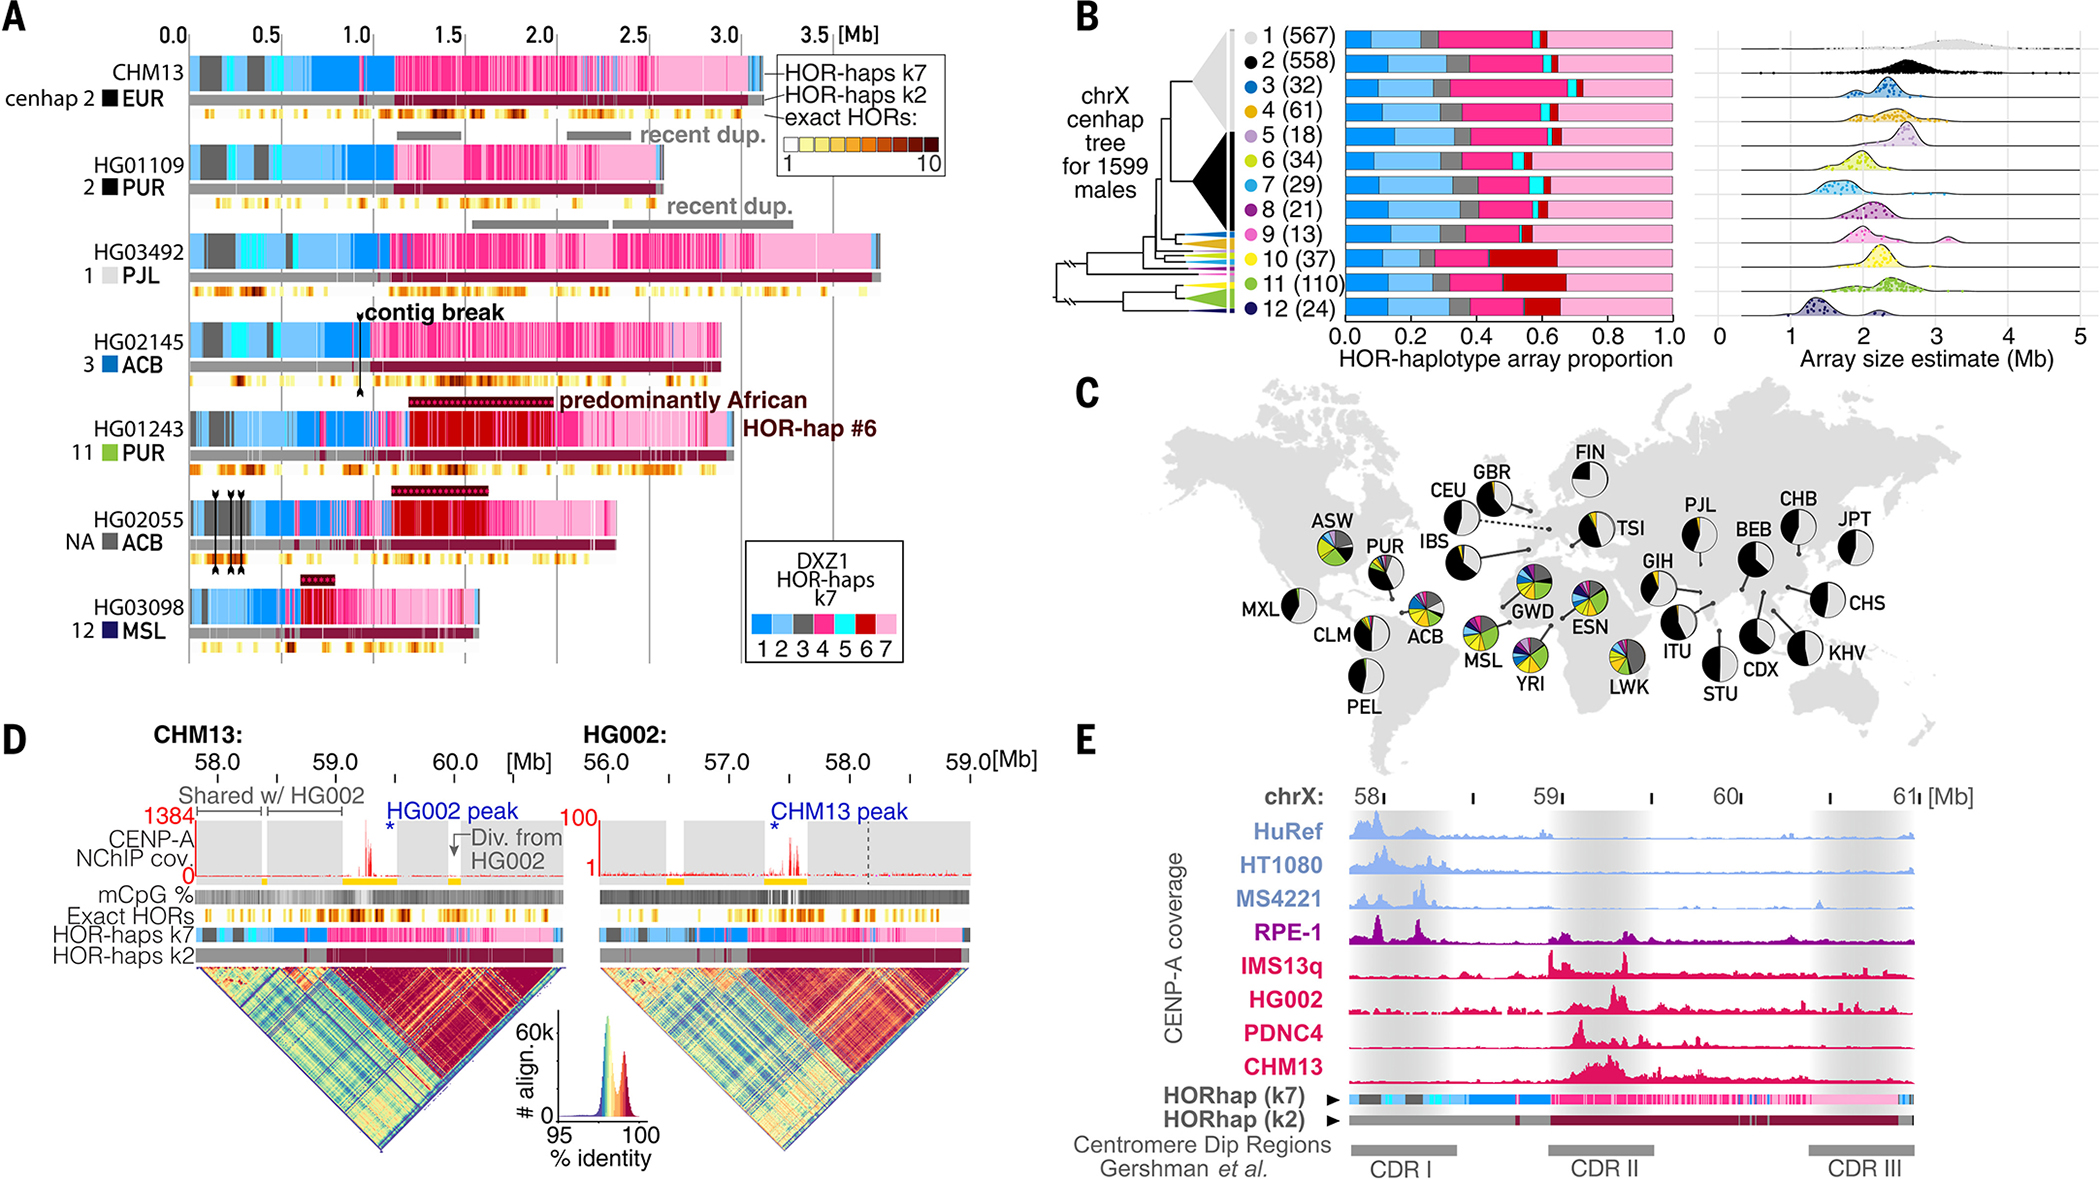
Fig. 5. Substantial genetic and epigenetic variation in and around the chrX centromere.

(A) Comparing the active αSat HOR array on chrX (DXZ1) between (top) CHM13 and six HPRC cell line HiFi read assemblies. Tracks indicate HOR-haps (top, k = 7; bottom, k = 2) and recent HOR duplication events (bottom, as in Fig. 4A). (B) (Left) Phylogenetic tree illustrating the relationships of 12 cenhaps defined by using short-read data from 1599 XY genomes from (70, 73) plus HG002, CHM13, and HuRef. Triangle vertical length is proportional to the number of individuals in that cenhap (98 individuals, labeled NA and colored dark gray, belong to small clades not among the 12 major cenhaps). (Middle) Barplots illustrating the average HOR-hap compositions for all individuals within each cenhap, colored as in (A). (Right) Ridgeline plots indicating the distribution of estimated total array sizes for all individuals within each cenhap, with individual values represented as jittered points. (C) Populations represented among the 1599 XY genomes, with pie charts indicating the proportion of cenhap assignments within each population, with the same colors used as in the tree in (B). Population descriptions are in (42). (D) Comparison of the DXZ1 assembly for CHM13 and HG002, which are both in cenhap 2. Tracks are as in (A), with the addition of a top track to indicate regions that align closely (gray) or are diverged (yellow) between the two individuals. Vertical dotted line indicates the homologous site of a CHM13 expansion on the HG002 array. (Bottom) StainedGlass dotplots representing the percent identity of self-alignments within the array, with a color-key and histogram below (88). (E) A comparison of CENP-A coverage (NChIP-seq or CUT&RUN) in eight cell lines relative to the CHM13 chrX centromere assembly. Each track is normalized to its maximum peak height in the array. Below are CDR positions from (26).
