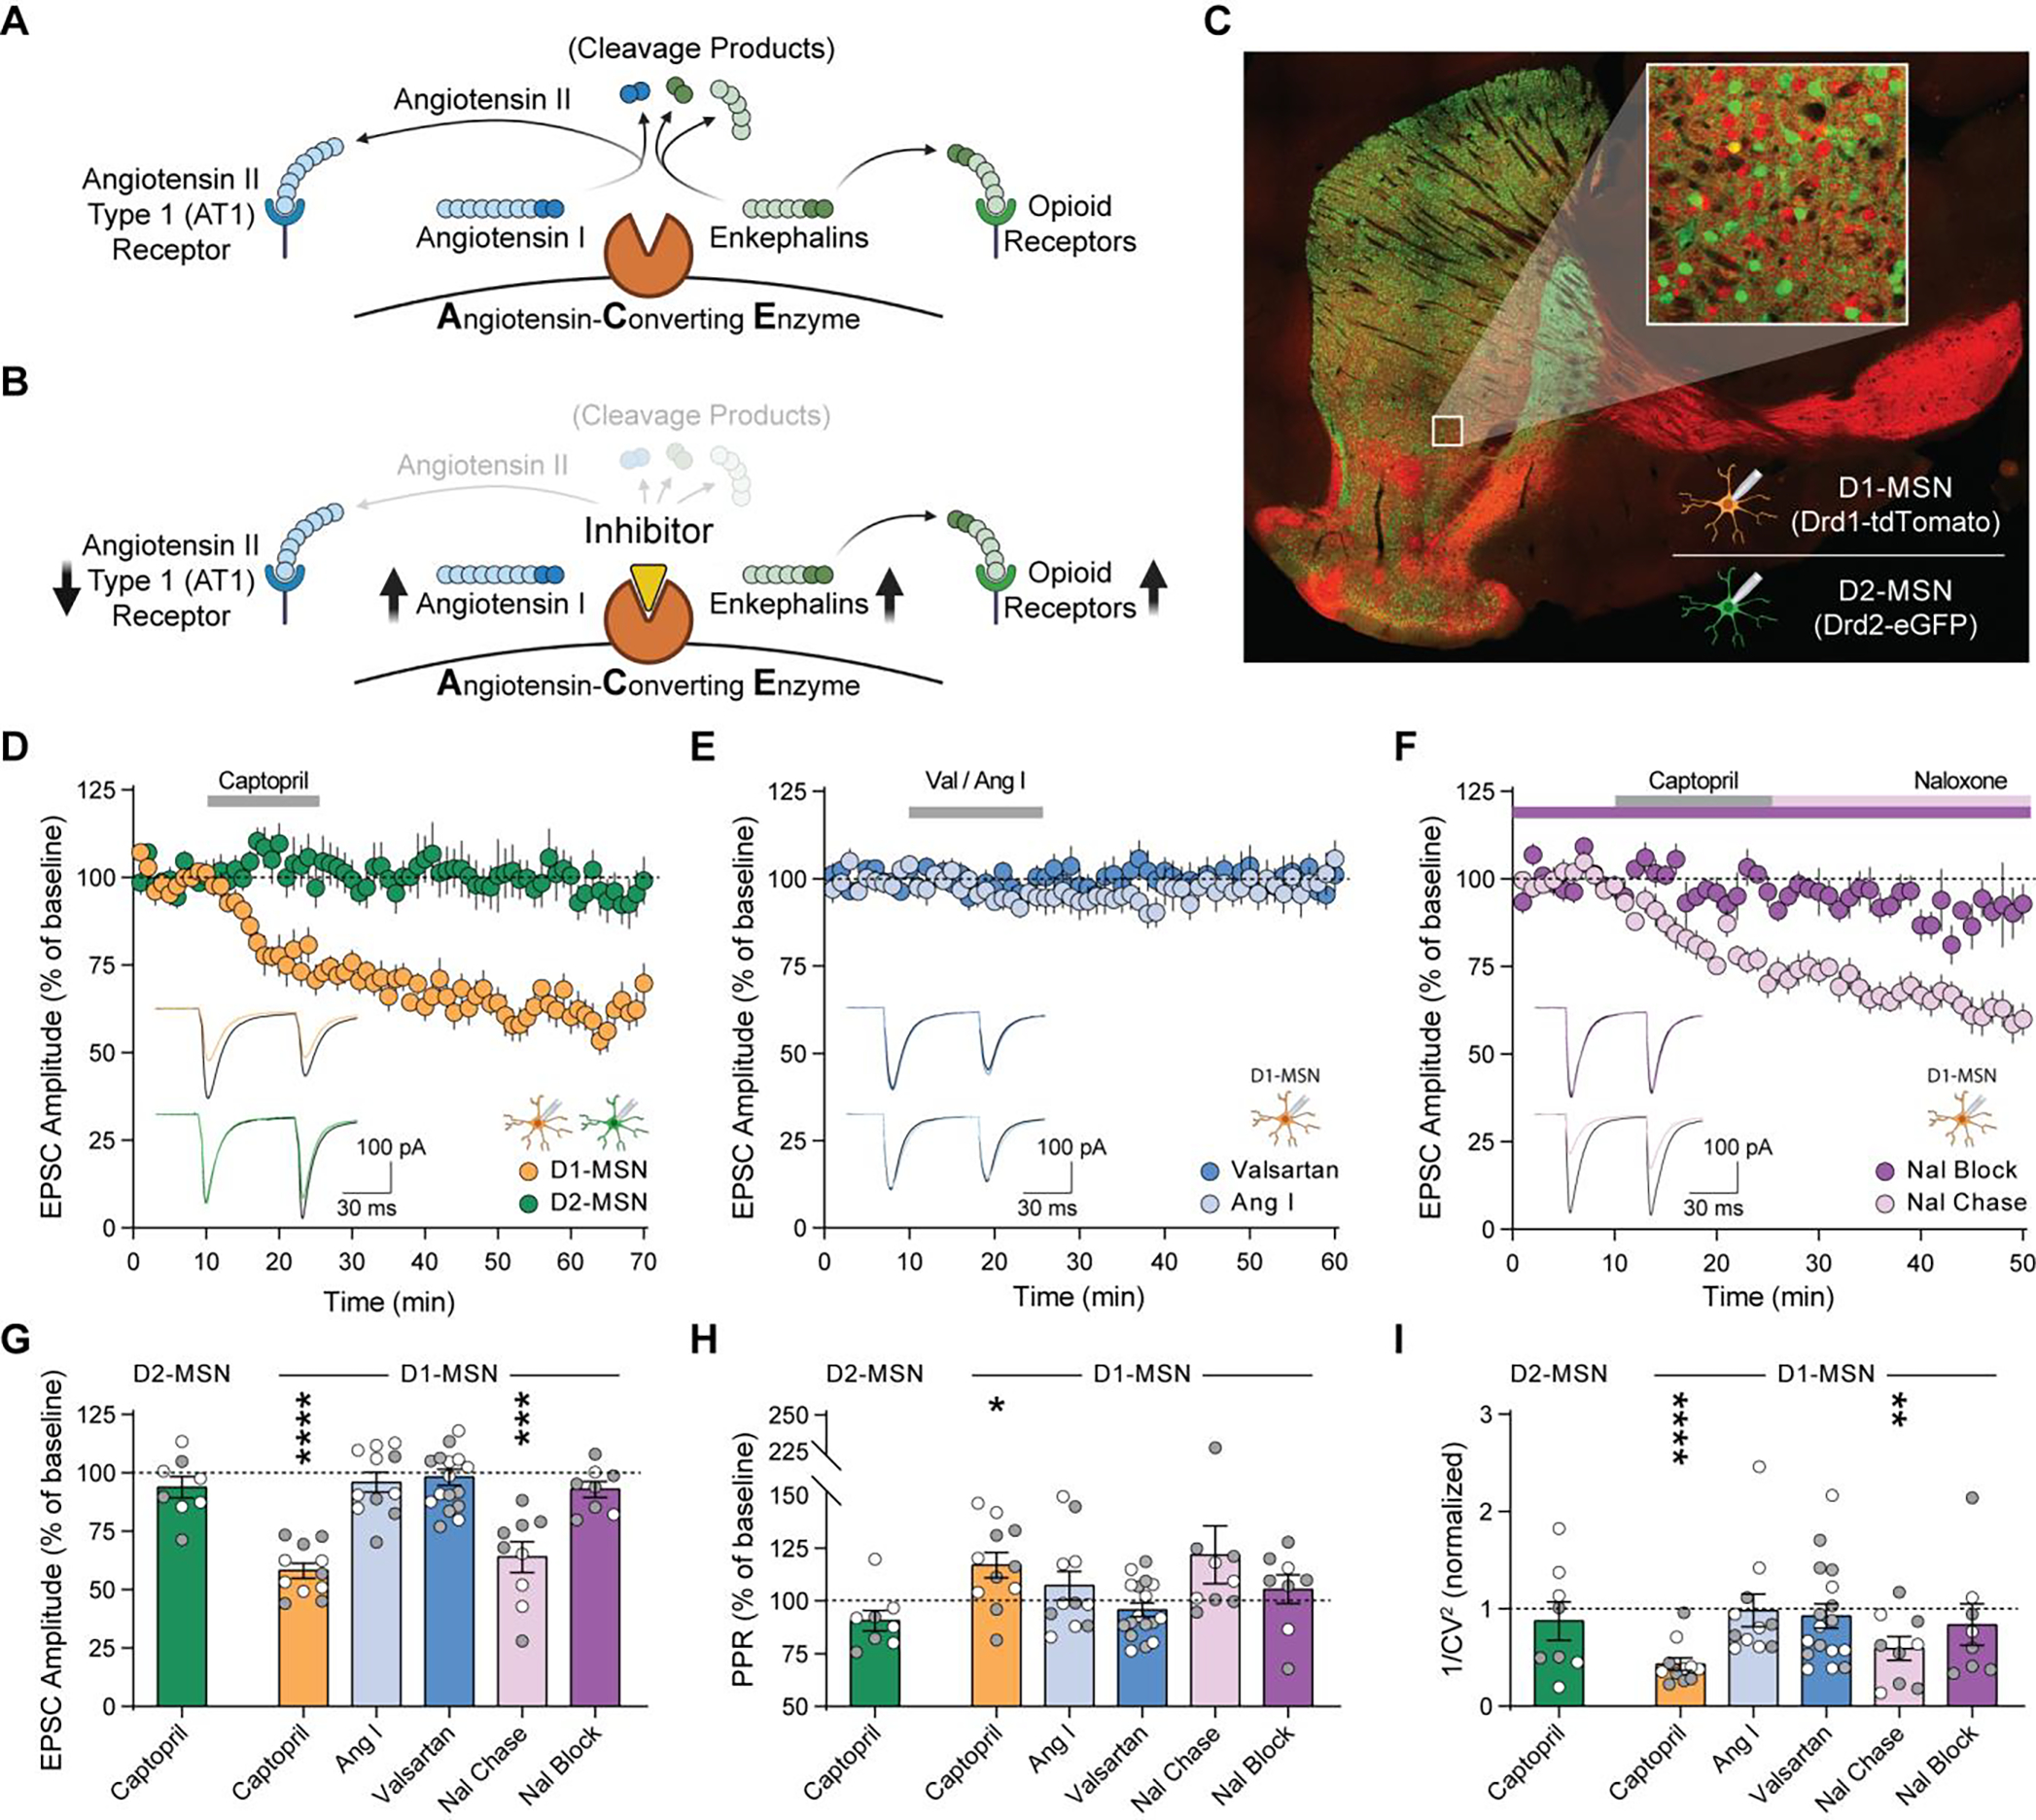
Fig. 1. ACE inhibition reduces excitatory input to D1-MSNs via endogenous opioid signaling.

(A, B) Schematic of angiotensin and enkephalin regulation by ACE, in the absence (A) and presence (B) of ACE inhibition. (C) Drd1-tdTomato expression (red) in D1-MSNs, and Drd2-eGFP expression (green) in D2-MSNs. (D-F) EPSC amplitude before, during, and after 15 min bath perfusion (grey bar) of 10 μM captopril in D1-MSNs (orange, n=11) or D2-MSNs (green, n=8) (D); AT1R antagonist valsartan (dark blue, 2 μM n=8 and 20 μM n=9) or angiotensin I peptide (1 μM, light blue, n=11) in D1-MSNs (E); or captopril (10 μM) in continual presence of opioid receptor antagonist naloxone (10 μM, dark purple, n=8) or chased by naloxone (10 μM, light purple, n=9) in D1-MSNs (F). Bottom-left insets show traces before (black lines) and after (last 5 min of recording, colored lines). (G-I) EPSC parameters during the last 5 min of each recording, expressed as percentage of baseline prior to drug application: EPSC amplitude (G), paired-pulse ratio (H), and 1/CV2 (I). Data are mean ± s.e.m. for all panels; open and closed circles indicate recordings from female and male mice, respectively. *P<0.05, **P<0.01, ***P<0.001, ****P<0.0001, ANOVA followed by one-sample t-test versus baseline; see Data S1 for complete statistics.
