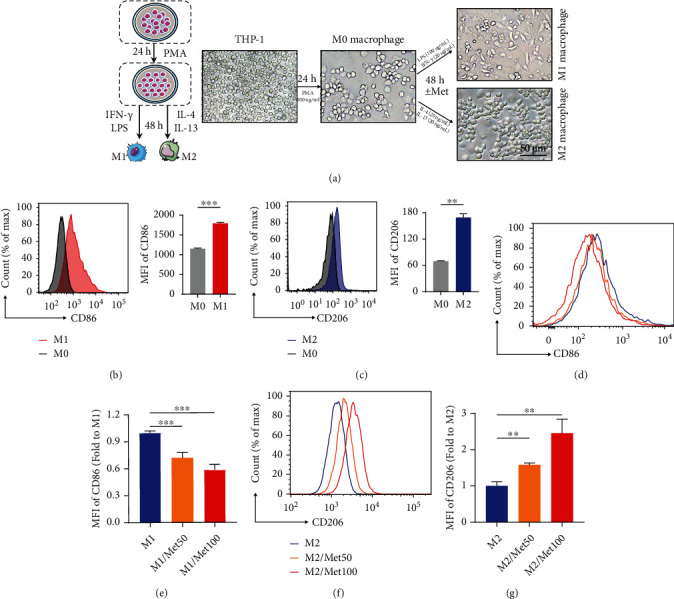
Figure 4.

Metformin regulated macrophage polarization towards M2 phenotype. (a) Schematic diagram of polarization of macrophages from THP-1 to M1/M2 populations. (b, c) Representative graphs and statistical histograms of MFI of CD86 maker in M1-induced group and CD206 in M2-induced group versus M0 populations. (d) Flow cytometry plot of CD86 (M1 maker) with different doses of metformin. (e) Quantitative analysis of the MFI of CD86. (f) Representative image of CD206 (M2 maker) with different doses of metformin. (g) Quantitative analysis of the MFI of CD206. Data represented as mean ± SD from three independent experiments. ∗∗P < 0.01, ∗∗∗P < 0.001.
