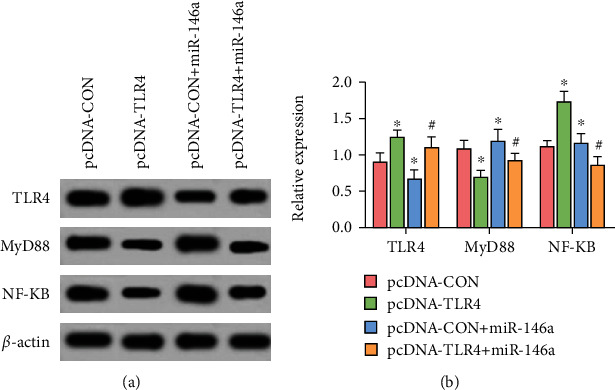
Figure 8.

Western blot detection of TLR4, MyD88, and NF-κB protein levels. (a) Gray value of TLR4, MyD88, and NF-κB proteins. (b) Relative expression of TLR4, MyD88, and NF-κB proteins. + and ∗ are comparisons with pcDNA-CON and pcDNA − CON + miR − 146a groups, respectively; P < 0.05; n = 3.
