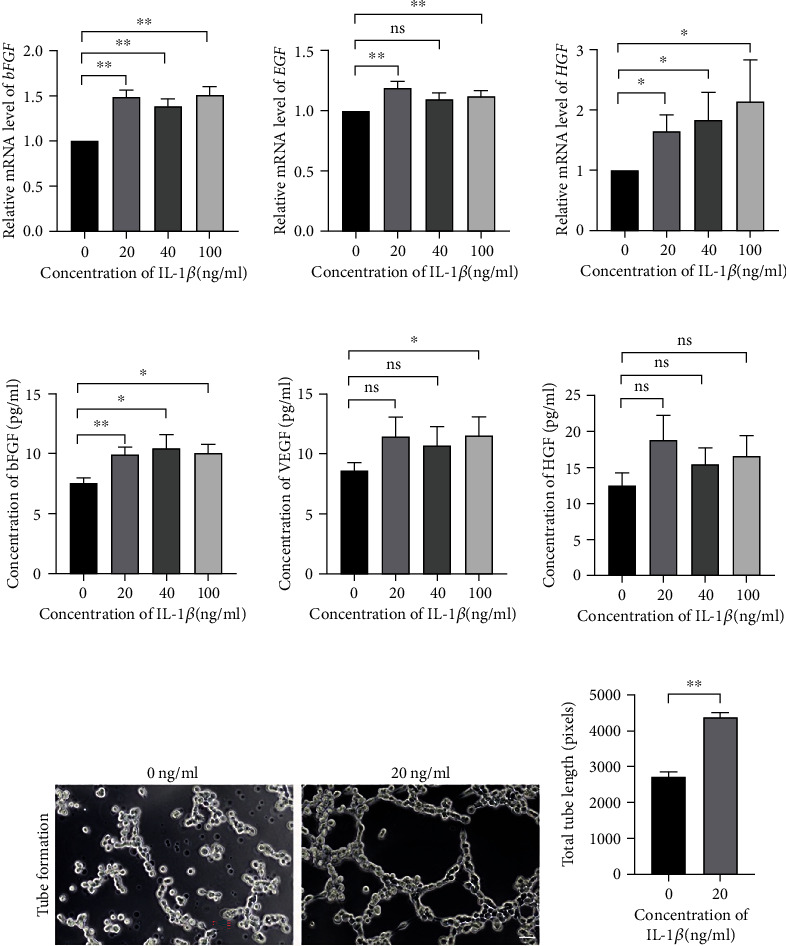
Figure 6.

HUC-MSCs responded to the IL-1β microenvironment with the releasing of neovascularization factors to promote angiogenesis. (a) Quantitation of the relative gene expression of angiogenesis markers (bFGF, EGF, and HGF) in the hUC-MSCs with the various concentration of IL-1β induction. Data was reported as mean ± S.E.M of 3 independent cultures, tested for significant difference (∗P < 0.05, ∗∗P < 0.01, ns = nonsignificant) using Student's t-test. (b) Luminex analyzed the protein concentration of angiogenesis markers (bFGF, VEGF, and HGF) in the stimulated hUC-MSCs supernatant. Data was reported as mean ± S.E.M of 3 independent cultures supernatant, tested for significant difference (∗P < 0.05, ∗∗P < 0.01, ns = nonsignificant) using Student's t-test. (c) Phase contrast images of HUVEC cultured in the hUC-MSCs supernatant with or without the IL-1β induction. Scale bar = 50 μm. (d) Quantification of tube length of HUVEC culturing within the supernatant from the hUC-MSCs with or without the IL-1β induction. Results were presented as mean ± S.E.M of approximately 60 pictures from 3 independent cultures, tested for significant difference (∗∗P < 0.01) using Mann–Whitney rank sum test.
