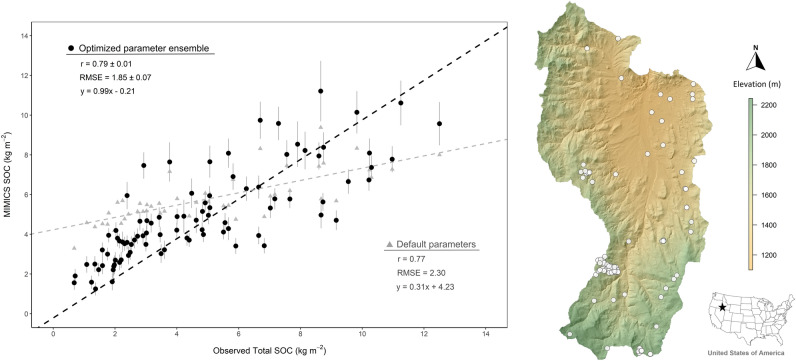
Figure 2.
Comparison of the MIMICS model estimates with observed soil organic carbon stocks (kg C m2, 0–30 cm soil depth) at locations across the Reynolds Creek Experimental Watershed and Critical Zone Observatory (n = 89). Black dots and associated error bars denote the mean ± standard deviation of the model estimates produced using each member of the optimized parameter ensemble. Grey triangles represent MIMICS estimates using the default MIMICS model parameterization. (Generated by free software R, https://www.R-project.org/).

