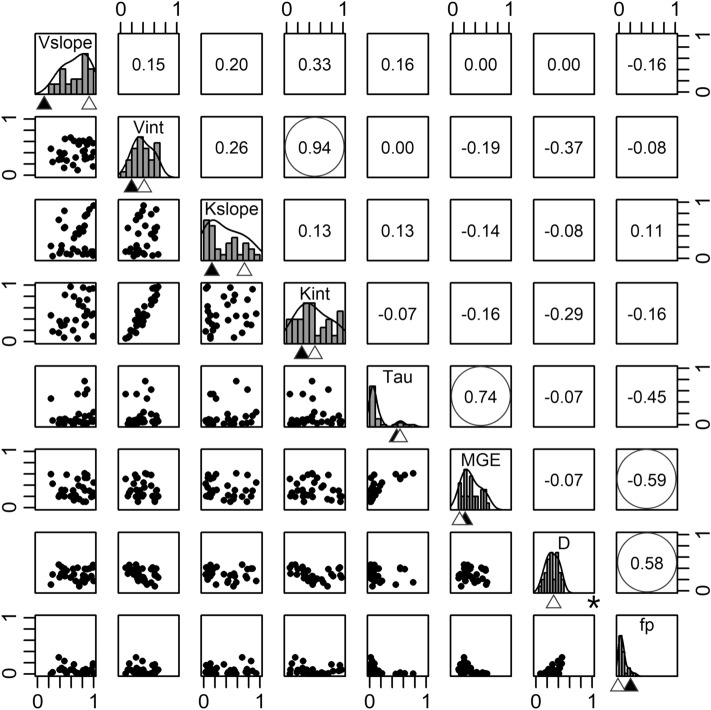
Figure 3.
MIMICS model parameter space and relationships among parameters in the parameter ensemble that produced similarly accurate (RMSE 1.8–2.0) estimates of total soil organic C stocks across the Reynolds Creek Experimental Watershed and Critical Zone Observatory (n = 30 member parameter ensemble). Normalized parameter range coincides with the scaling factor proposal range for each parameter (see Table 1). Histograms on the diagonal represent the uncertainty in parameter estimates from the parameter ensemble. Triangles below histograms represent default (closed) and best-fit (open) parameter values. Off-diagonal panels display pairwise correlations and correlation coefficients between individual parameters, with statistically significant correlations circled (p < 0.05). *Default parameter line for D is beyond plot scale (Ddefault = 3.1). (Generated by free software R, https://www.R-project.org/).

