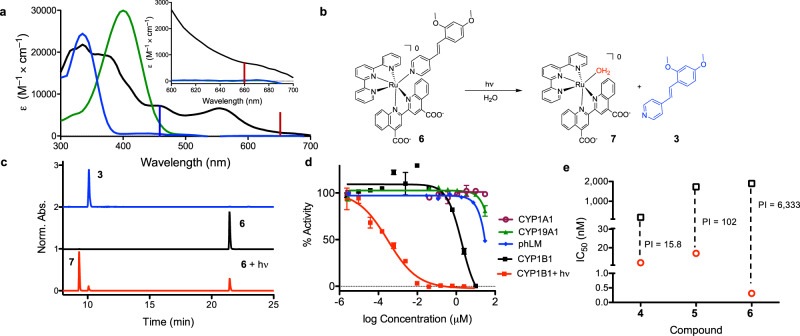
Fig. 4. Photocontrol of a Ru(II) complex containing a CYP1B1 inhibitor.
a Absorption spectra of 6 (black, solid line) in phosphate buffered saline (PBS), 3 in MeCN (blue, solid line), and 3 in MeCN following protonation with 1% formic acid (green, solid line). The excitation wavelengths for the blue and red LEDs are indicated with vertical bars. Inset shows an expansion of the 600–700 nm region. b Photoejection scheme for 6 in water. c HPLC analysis showing the chromatograms for 3, 6, and 6 following irradiation with 660 nm light (58.7 J/cm2). The formation of complex 7 and inhibitor 3 were verified by UV/Vis (Supplementary Fig. 11). The protonated form of 3 was observed due to the presence of acid in the HPLC mobile phase. Detection wavelength = 280 nm. d Dose–responses for 6 for enzyme inhibition in the dark with CYP1A1, 19A1, and pooled human liver microsomes (phLM), CYP1B1, and with 1B1 following irradiation with 660 nm light (58.7 J/cm2) (n = 3; the error bars correspond to the standard deviation of the three replicates). e Comparison of potency and PI values (the ratio of the IC50 for enzyme inhibition in the dark vs. light) for Ru(II) complexes 4–6 (IC50 in the dark (black squares) and activated with 660 nm light (red circles)). This data demonstrates a range of 103 due to improvement in both the inhibitor, with a shift to lower IC50 values, and Ru(II) scaffold, with the increase in the IC50 in the dark.

