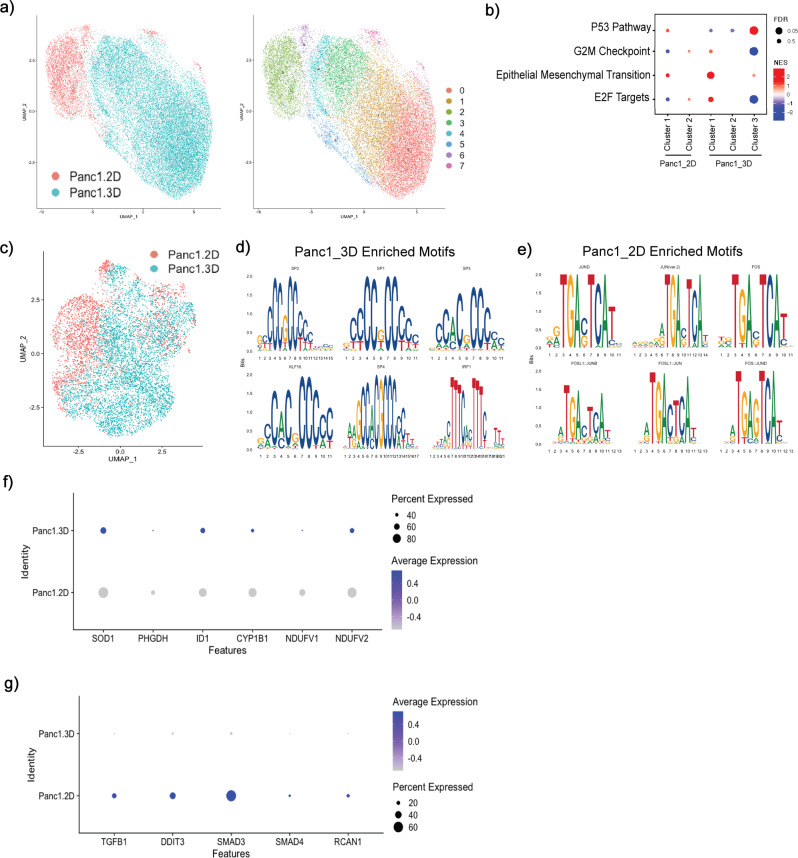
Fig. 5. Spheroid growth model promotes transcriptional heterogeneity and epigenetic remodeling.
a UMAP overlaying scRNA of Panc1 samples and their unique clusters. b Pathway enrichment profiles defined by GSEA analysis for Panc1-2D and Panc1-3D spheroid cell clusters. Size of dot represents FDR, red indicates upregulation, blue indicates downregulation of the pathway. c UMAP representing snATAC-seq data of merged Panc1 samples. d, e Analysis of merged Panc1 snATAC data shows enrichment in Sp/Klf motifs in spheroid data, and enrichment of Fos/Jun motifs in 2D monolayer culture. f Comparison of expression of genes associated with Sp/Klf transcription factors in scRNA of Panc1 2D and Panc1 3D. g Comparison of expression of genes associated with Fos/Jun transcription factors in scRNA of Panc1 2D and Panc1 3D.

