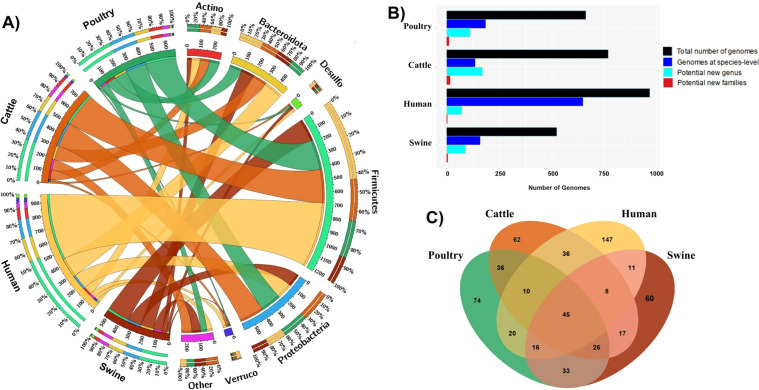
Fig. 3.
Taxonomy and host-distribution of MAGs. (A) Circus plot demonstrating the abundance of phyla in each host microbiome. The external track indicates the relative number (%) of phyla or host. The internal track shows the absolute number of MAGs generalized by phyla or host, (B) Number of potential novel lineages for each host microbiome, and (C) Absolute number of shared MAGs assigned to the genus level between host-associated microbiomes (human, swine, cattle, and poultry).

