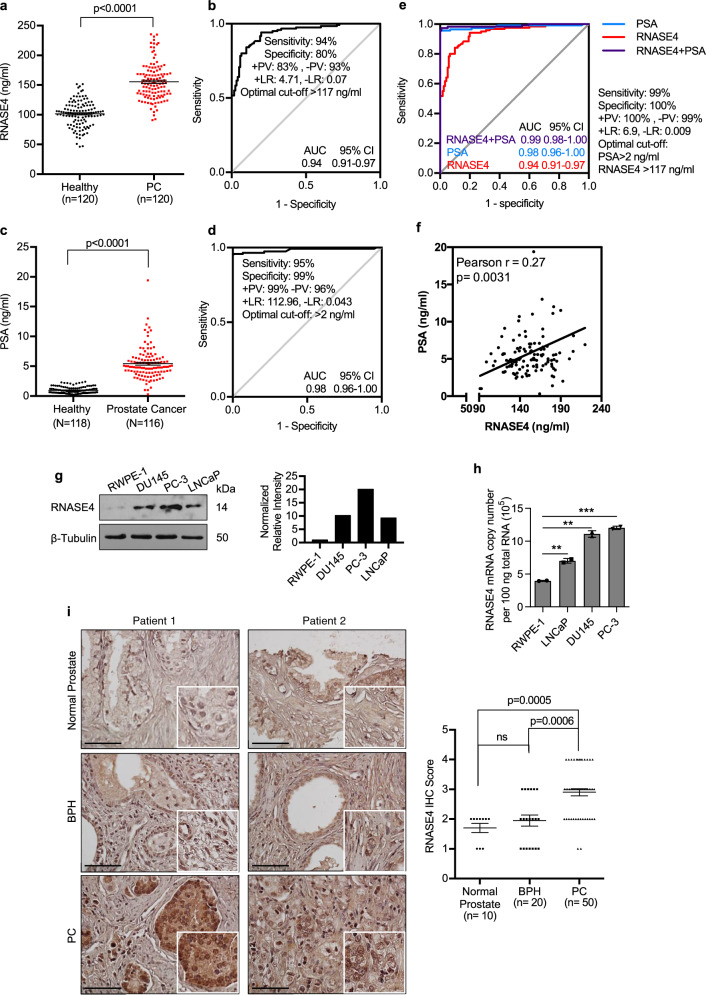
Fig. 1. Up-regulation of RNASE4 in prostate cancer.
a RNASE4 protein levels in the plasma of healthy control subjects (n = 120) and prostate cancer (PC) patients (n = 120). RNASE4 amounts were determined by ELISA. Each dot represents an individual sample. Lines mark the median values and interquartile ranges. b Operating Characteristic Curve (ROC) analysis of RNASE4. AUC, area under the curve; +PV, positive predictive value; –PV, negative predictive value; +LR, positive likelihood ratio; -LR, negative likelihood ratio. c PSA levels in plasma samples of healthy control subjects (n = 120) and prostate cancer patients (n = 120). Each dot represents an individual sample. Lines mark the median values and interquartile ranges. d ROC analysis of PSA. e Combined ROC curve analysis of PSA and RNASE4 showed improved sensitivity and specificity at cut-off values 2 ng/ml and 117 ng/ml, respectively. f Correlation between PSA and RNASE4 in all plasma samples (n = 240). g Immunoblot analysis of RNASE4 from normal prostate epithelial cell line RWPE-1 and prostate cancer cell lines DU145, PC-3, and LNCaP. Top panel, immunoblots; bottom panel, quantification of RNASE4 protein levels by Image J using Tubulin as loading controls. h RNASE4 mRNA copy numbers in 100 ng total RNA of normal prostate and cancer cell lines determined by qRT-PCR. **p ≤ 0.01 and ***p ≤ 0.001, by unpaired two-tailed Student’s t test. i IHC analysis of RNASE4 in tissue micro array. Left panels, two sets of representative images of prostate cancer, benign prostate hyperplasia (BPH) and normal prostate tissues, scale bars = 50 µm; right panel, semi-quantitative score of RNASE4 in prostate cancer (n = 50), BPH (n = 20), and normal prostate (n = 10) tissues. Data were analyzed by ANOVA using Dunnett’s multiple comparison test. Each dot represents score of an individual tissue sample. The horizontal lines in the plots represent the median values and the interquartile ranges.

