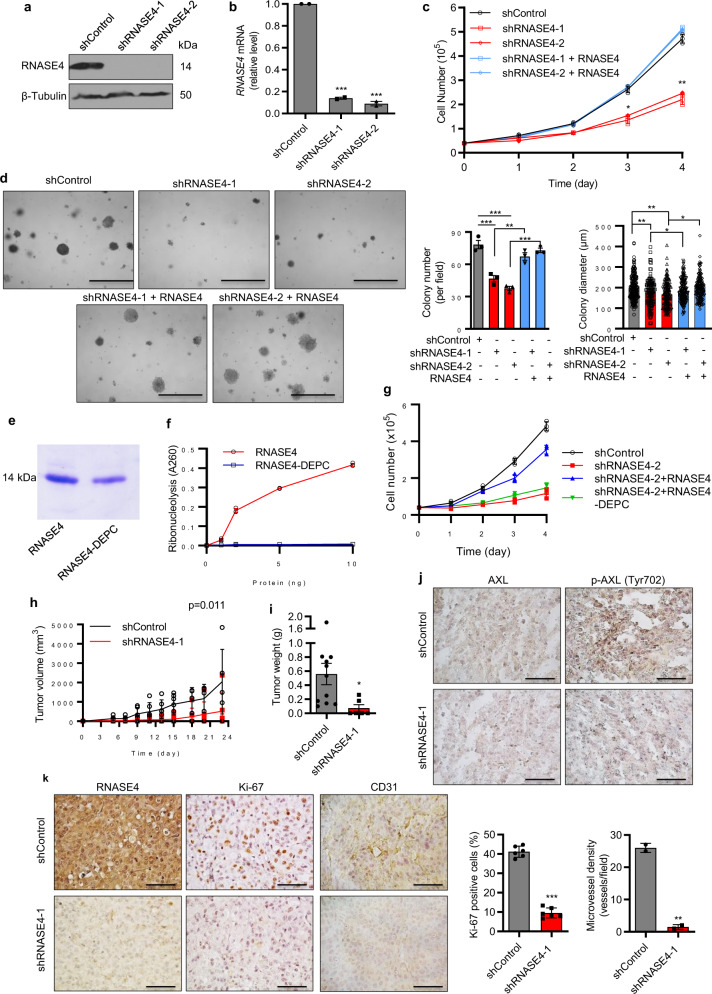
Fig. 5. RNASE4 knockdown reduces prostate cancer cell proliferation in vitro, in soft agar, and in athymic mice.
a Immunoblot analysis of RNASE4 in PC-3 cells stably transfected with shControl, shRNASE4-1, and shRNASE4-2. b qRT-PCR analysis of RNASE4 mRNA normalized to GAPDH in PC-3 cells stably transfected with shControl, shRNASE4-1, and shRNASE4-2. c Effect of RNASE4 knockdown on cell proliferation. Cell numbers were counted by a Coulter counter. Exogenouse RNASE4, when presented, was at the concentration of 1 µg/ml. Data shown are a representative experiment (in triplicates) of 3 independent repeats. d Effects of RNASE4 knockdown on colonies formation and growth of PC-3 cells in soft agar. The same numbers of control and RNASE4 knockdown cells were seeded in soft agar, and grown in the absence or presence of 1 µg/ml of RNASE4 for 14 days. Colonies were counted and size measured on a Nikon Eclipse ti microscope. Left panels, representative images of colonies; scale bars =100 μm. Right panels, quantification of colony numbers and sizes. e SDS-PAGE of RNASE4 and RNASE4-DEPC. f Ribonucleolytic activity of RNASE4 and RNASE4-DEPC measured by the tRNA cleavage method. g Effect of RNASE4 and RNASE4-DEPC (1 μg/ml) on proliferation of RNASE4 knockdown PC-3 cells. Cell numbers were determined by MTT assay. Data shown are a representative experiment (in triplicates) of 3 independent repeats. h Growth curve of PC-3 control and RNASE4 knockdown cells in athymic mice. Same number of shControl- and shRNASE4-1-tranfected PC3 cells (1 × 10⁶ per mouse) were inoculated s.c. on the right lower back of nude mice (n = 6 per group). Tumor volume was measured two times per week. i Tumor weight derived from control and RNASE4 knockdown PC-3 cells. On day 24, mice were sacrificed, and their tumors were dissected and weighed. j IHC analyses of total AXL and phosphoylated AXL (p-AXL) in tumor sections derived from control and RNASE4 knckdown PC-3 cell. k IHC analyses of RNASE4, Ki-67, and CD31 in tumor sections derived from control and RNASE4 knckdown PC-3 cell. Quantification of Ki-67 positive cells and CD31 positive neovessels were from 5 randomly selected microscopic fields. Scale bars =100 µm. Data shown are means ± SEM. Scale bars =100 µm. *p ≤ 0.05, **p ≤ 0.01 and ***p ≤ 0.001, by two-tailed Student’s t test.

