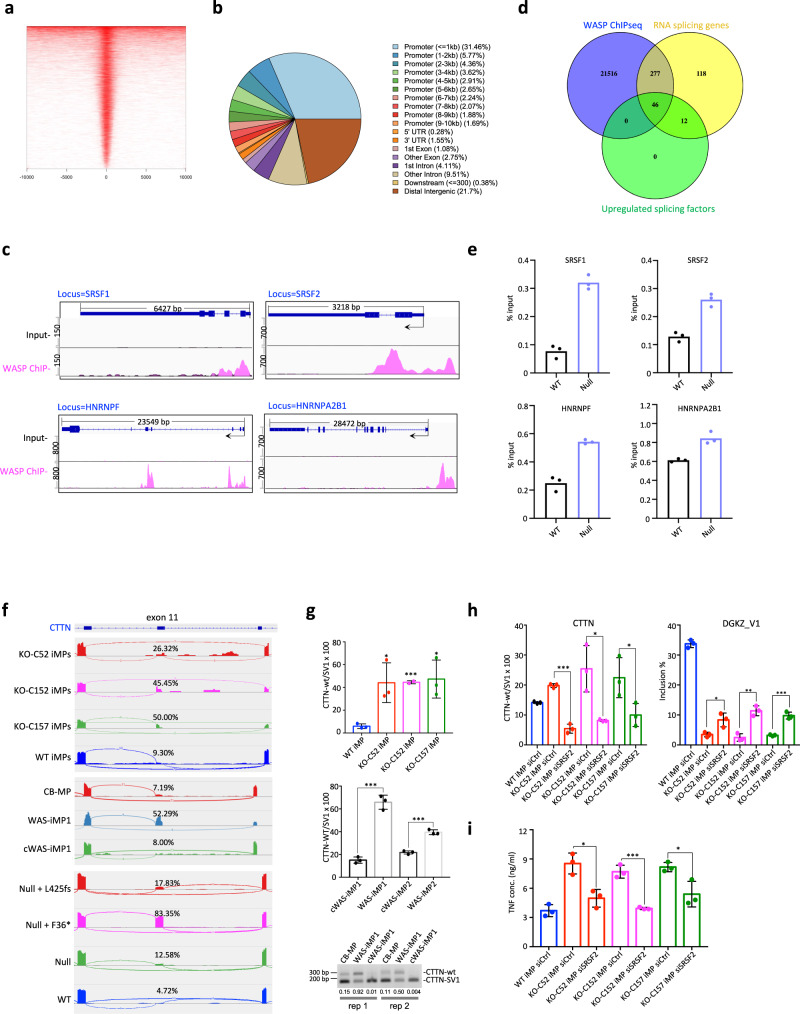
Fig. 5. WASP binds to promoters of splicing-factor genes to regulate their transcription.
a Heatmap of endogenous WASP ChIP-seq peaks around the TSS. b Genomic annotation of WASP ChIP-seq peaks. c WASP ChIP-seq peaks located in SF genes visualized in Integrative Genomics Viewer (IGV). d Venn diagram shows overlap between WASP-bound genes, RNA-splicing genes (GO term 0008380), and upregulated SFs of KO-iMPs. The hypergeometric testing P value is 1.27 × 10−56 for RNA-splicing term vs WASP ChIPseq and 5.21 × 10⁻¹² for upregulated SF vs WAS ChIPseq. e Representative ChIP-qPCR results of the level of H3K27ac in WASP binding sites in selected SF genes. Biological replicates n = 2 for gene SRSF1 and HNRNPF, and for gene SRSF2 and HNRNPA2B1 n = 3. One of the independent biological replicates is shown, and other biological replicate data are provided in a Source Data file. Data are shown as mean ± SEM. f Isoform-level analysis of RNA-seq data of macrophages and B-cell lines. The graph below the gene diagram shows IGV tracks of RNA-seq reads mapped to the CTTN gene. The numbers represent the percentage of exon 11-retained isoform in total isoforms. g Isoform-specific qRT-PCR analysis of two CTTN variants in macrophages. Bottom: Semi-quantitative RT-PCR shows expression of two CTTN isoforms in WAS-iMPs. Rep1 and Rep2: two biological replicates. The numbers below the gel pictures are densitometry ratio of CTTN-wt and CTTN-SV1. *P = 0.0196 (KO-C52 iMP), *P = 0.0131 (KO-C157 iMP), ***P = 0.0002 (KO-C152 iMP), ***P = 0.0002 (WAS-iMP1), ***P = 0.0003 (WAS-iMP2). h qRT-PCR analysis of the expression of the CTTN and DGKZ isoforms upon knockdown of SRSF2 in KO-iMPs. Biological replicate n = 3. CTTN: *P = 0.0181 (KO-C152 iMP), *P = 0.0487 (KO-C157 iMP), ***P = 0.0001; DGKZ_V1: *P = 0.0256, **P = 0.0017, ***P = 0.0007. i ELISA quantitation of TNF secretion by indicated macrophages upon stimulation with LPS. Biological replicate n = 3. *P = 0.0116 (KO-C52 iMP), *P = 0.026 (KO-C157 iMP), ***P = 0.0006. All statistics in this figure were done using a two-sided Student’s t test. Data in (g–i) are shown as mean ± SD.

