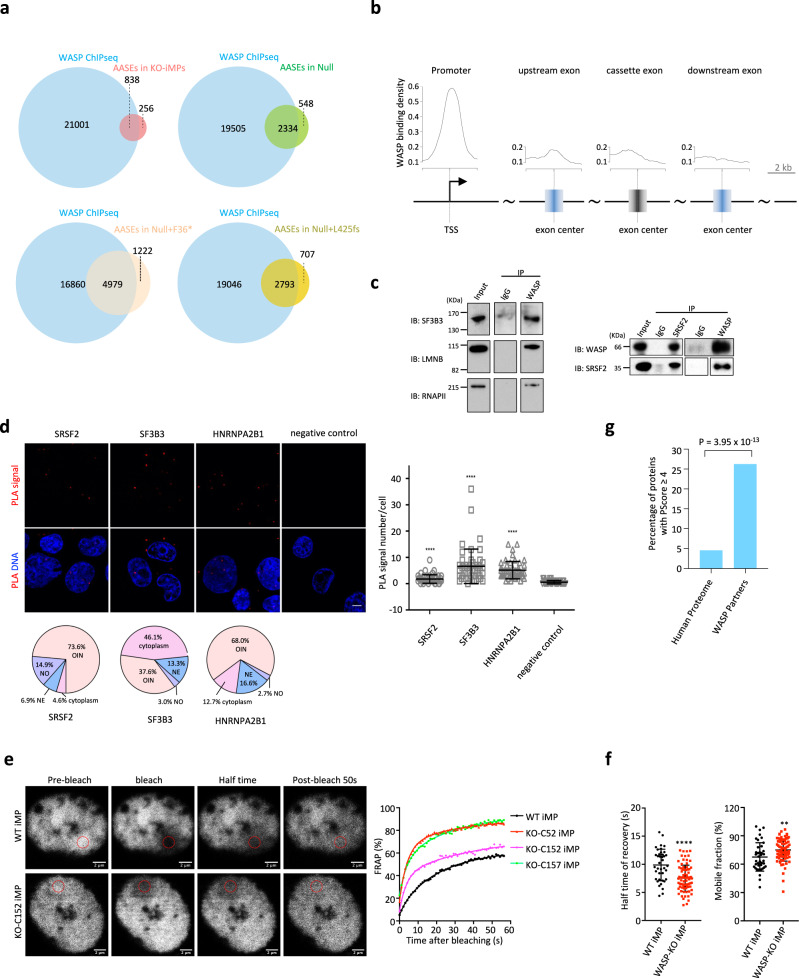
Fig. 6. WASP directly binds alternatively spliced genes and physically interacts with splicing factors.
a Venn diagram of WASP-bound genes and AASEs in WASP mutant cells. Hypergeometric testing P values are 1.39 × 10−41 (KO-iMPs), <10−324 (Null), <10−324 (Null + F36*), and <10−324(Null + L425fs). b WASP ChIP-seq signal density plotted around the center of the TSS and the cassette and flanking exons of all AASE genes identified in WASnull B cells (shown in (a)). The vertical lines in the model gene diagram indicate the center of the elements. The distance from the center in kb is given by the scale bar. The y axes are drawn to the same scale. c co-IP validation of physical interaction between WASP and selected proteins. IP immunoprecipitation, IB immunoblotting. This experiment was done once for SF3B3, LMNB, and RNAPII, and twice for SRSF2. d Representative immunofluorescence images of PLA signals for WASP-SRSF2, WASP-SF3B3, and WASP-HNRNPA2B1 in the WT B-cell line. The pie chart below each image shows the percentage of PLA signals in different cellular compartments. Right: quantitative analysis of PLA signals. Cell number n = 50 for each setting. Data are shown as mean ± SEM. Mann–Whitney test, ****P < 0.0001. Nuclei were stained with DAPI. Bar = 5 μm. NE nuclear envelope, NO nucleolus, OIN other locations inside the nucleus. e Left: representative FRAP images of SRSF2-GFP expressing WT and WASP-KO-iMPs (KO-C152 is shown here, and other clones are shown in Supplementary Fig. S10i). Scale bar = 2 µm. Right: time-lapse FRAP curve of SRSF2-GFP fluorescence generated from representative iMP cells. f Statistic analysis for the half time of FRAP recovery and mobile fraction of SRSF2-GFP fluorescence in WT (n = 39) and WASP-KO-iMPs (n = 78). Data are shown as mean ± SD. Two-sided Student’s t test, **P = 0.004, ****P < 0.0001. Source data are provided as a Source Data file. g Percentage of predicted phase-separation proteins (PScore ≥ 4) in the human proteome (n = 18,476) and WASP partners among nuclear speckle proteins (n = 95). P value is calculated with Fisher’s exact test. Source data are provided as a Source Data file.

