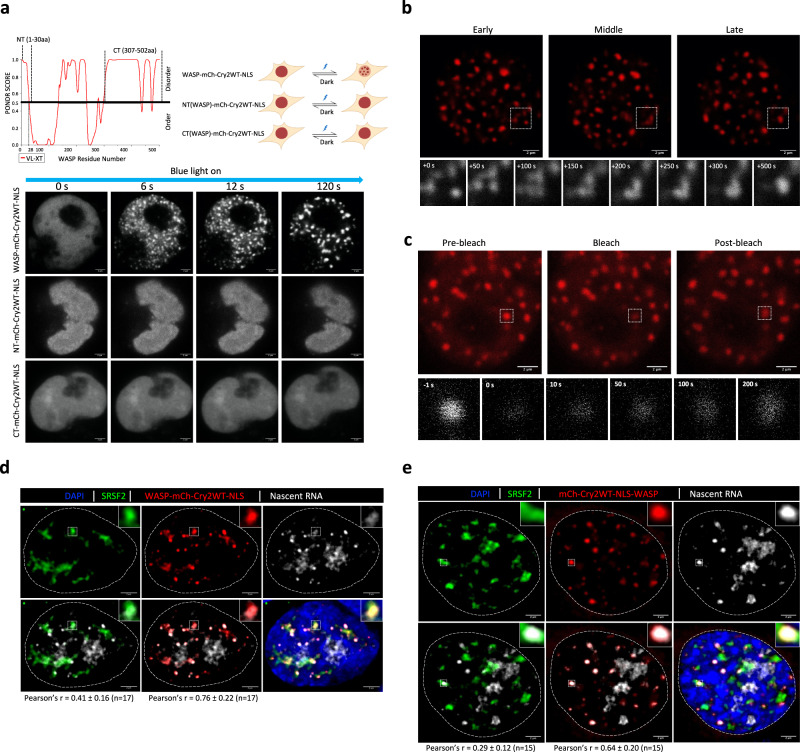
Fig. 7. WASP forms condensates in the nucleus and clusters with SRSF2 and nascent RNA.
a Top: schematic diagram of Cry2-based optogenetic constructs of WASP and its N-terminal (NT) and C-terminal (CT) IDRs (created with BioRender.com). The NT and CT locations are shown on the top of PONDR IDR prediction diagram. Bottom: time-lapse confocal images of HEK293 cells expressing photo-activated optogenetic constructs of WASP, NT, or CT following photoactivation. Scale bar = 2 µm. The experiment was repeated at least three times independently. b Confocal imaging of fusion of optoWASP optogenetic droplets after blue light activation. Time-lapse images of the region framed in the box are shown below. Scale bar = 2 µm. The experiment was repeated at least three times independently. c Confocal images showing fluorescence recovery after photobleaching (FRAP) of optoWASP droplets. Time-lapse images of the region framed in the box are shown below. Scale bar = 2 µm. The experiment was repeated at least three times independently. d Representative single-plane confocal images and colocalization analysis of optoWASP droplets (N-terminal WASP) with endogenous SRSF2 and nascent RNA. Insets show the framed region in the images. Scale bar = 2 µm. The Pearson correlation coefficient of colocalization (Pearson’s r) was calculated using the Leica LAS X software. Analyzed image n = 17, data are shown as mean ± SD. e Representative single-plane confocal images and colocalization analysis of optoWASP droplets (C-terminal WASP) with endogenous SRSF2 and nascent RNA. Insets show the framed region in the images. Scale bar = 2 µm. The Pearson’s r was calculated using the Leica LAS X software. Analyzed image n = 15, data are shown as mean ± SD.

