Figure 1.
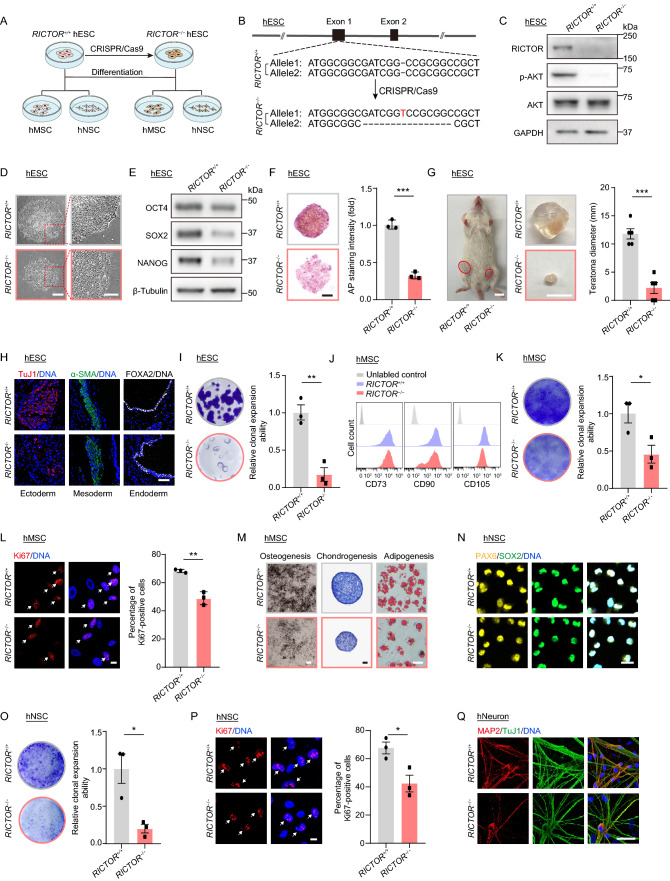
RICTOR deficiency attenuates pluripotency and differentiation abilities of hESCs, hMSCs and hNSCs. (A) Schematic diagram of the generation of RICTOR-deficient hESCs and hESC-derived hMSCs and hNSCs. (B) Schematic of the deletion of RICTOR via CRISPR/Cas9-mediated non-homologous end-joining (NHEJ). The diagram shows the first 2 out of 38 exons of RICTOR along with the edited sequence in exon 1. (C) Western blot analysis of RICTOR, phosphorylated AKT Ser473 and total AKT expression in RICTOR+/+ and RICTOR−/− hESCs. GAPDH was used as the loading control. (D) Representative phase-contrast images of RICTOR+/+ and RICTOR−/− hESC colonies. Scale bar, 200 μm and 100 μm (zoomed-in image). (E) Western blot analysis of the pluripotency markers OCT4, SOX2 and NANOG expression in RICTOR+/+ and RICTOR−/− hESCs. β-Tubulin was used as the loading control. (F) Representative alkaline phosphatase staining of hESCs. Scale bar, 200 μm. Data are representative of three biological repeats. ***P < 0.001. (G) Average diameters of teratomas formed by RICTOR+/+ and RICTOR−/− hESCs. Scale bar, 10 mm. Data are presented as mean ± SEM of five biological repeats. ***P < 0.001. (H) Immunofluorescence staining of the differentiation markers for three germ layers in teratoma, Scale bar, 50 µm. (I) Clonal expansion analysis of RICTOR+/+ and RICTOR−/− hESCs. Data are presented as mean ± SEM of three independent experiments. **P < 0.01. (J) Flow cytometry analysis of hMSC-specific surface markers CD73, CD90 and CD105 in RICTOR+/+ and RICTOR−/− hMSCs (passage 3). (K) Clonal expansion analysis of RICTOR+/+ and RICTOR−/− hMSCs (passage 4). Data are presented as mean ± SEM of three independent experiments. *P < 0.05. (L) Immunofluorescence analysis of Ki67 expression in RICTOR+/+ and RICTOR−/− hMSCs (passage 4). Scale bar, 10 µm. Data are presented as mean ± SEM of three biological repeats. **P < 0.01. (M) Characterization of the multilineage differentiation potentials of hMSCs (passage 4). Left, osteogenesis of RICTOR+/+ and RICTOR−/− hMSCs evaluated by von Kossa staining. Scale bar, 250 μm. Middle, chondrogenesis of RICTOR+/+ and RICTOR−/− hMSCs evaluated by Toluidine blue staining. Scale bar, 50 μm. Right, adipogenesis of RICTOR+/+ and RICTOR−/− hMSCs evaluated by Oil Red O staining. Scale bar, 50 μm. (N) Immunofluorescence staining for hNSC-specific markers PAX6 and SOX2 in RICTOR+/+ and RICTOR−/− of hNSCs (passage 3). Scale bar, 20 μm. (O) Clonal expansion analysis of RICTOR+/+ and RICTOR−/− hNSCs (passage 5). Data are presented as mean ± SEM of three independent experiments. *P < 0.05. (P) Immunofluorescence analysis of Ki67 expression in RICTOR+/+ and RICTOR−/− hNSCs (passage 5). Scale bar, 10 µm. Data are presented as mean ± SEM of three biological repeats. *P < 0.05. (Q) Immunofluorescence staining of hNeuron-specific markers MAP2 and TuJ1 in RICTOR+/+ and RICTOR−/− hNeurons. Scale bar, 50 µm

