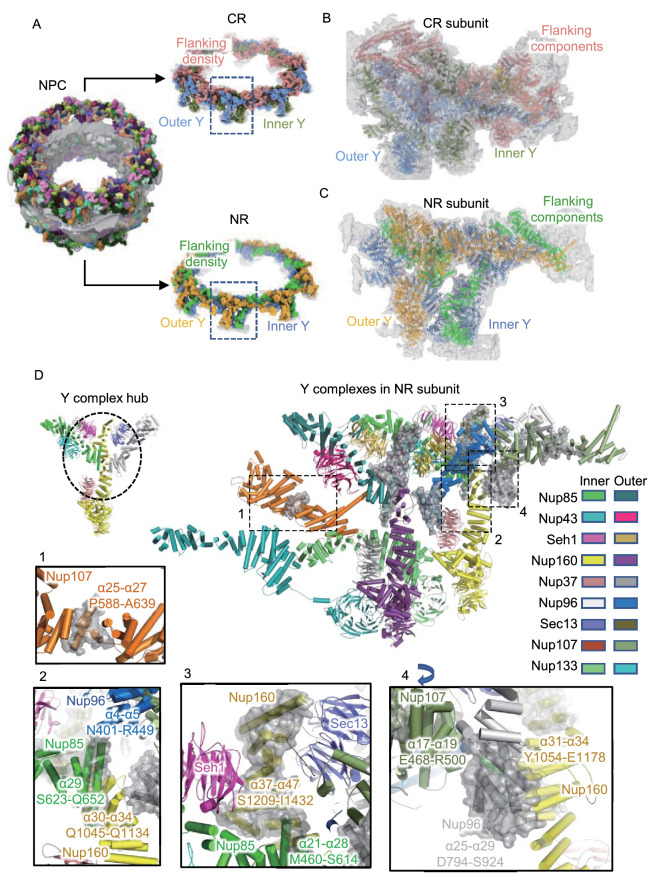
Figure 1.
The pseudoatomic model of the CR and NR from the X. laevis oocyte NPC. (A) Overall view of the X. laevis NPC CR and NR structure, displaying the inner and outer Y complexes in each asymmetric unit, as well as the densities other than the Y complexes. (B) Model-map overlay of the NPC CR subunit. The map density is displayed in gray with transparency. Models of the inner Y complex, outer Y complex and extra densities are in the same colors as in (A). (C) Model-map overlay of the NPC NR subunit. The map density is displayed in gray with transparency. Models of the inner Y complex, outer Y complex and extra densities are in the same colors as in (A). (D) Model display of two Y complexes in the NR subunit. All Nups are colored differently and labeled. The major differences compared with the previous 2015-model are highlighted in the transparent gray surface. Nup107 region and Y complex hub regions are shown in zoomed-in views. The 4th zoomed-in view is rotated for better display. Important regions are labeled with the sequence and secondary structure numbers

