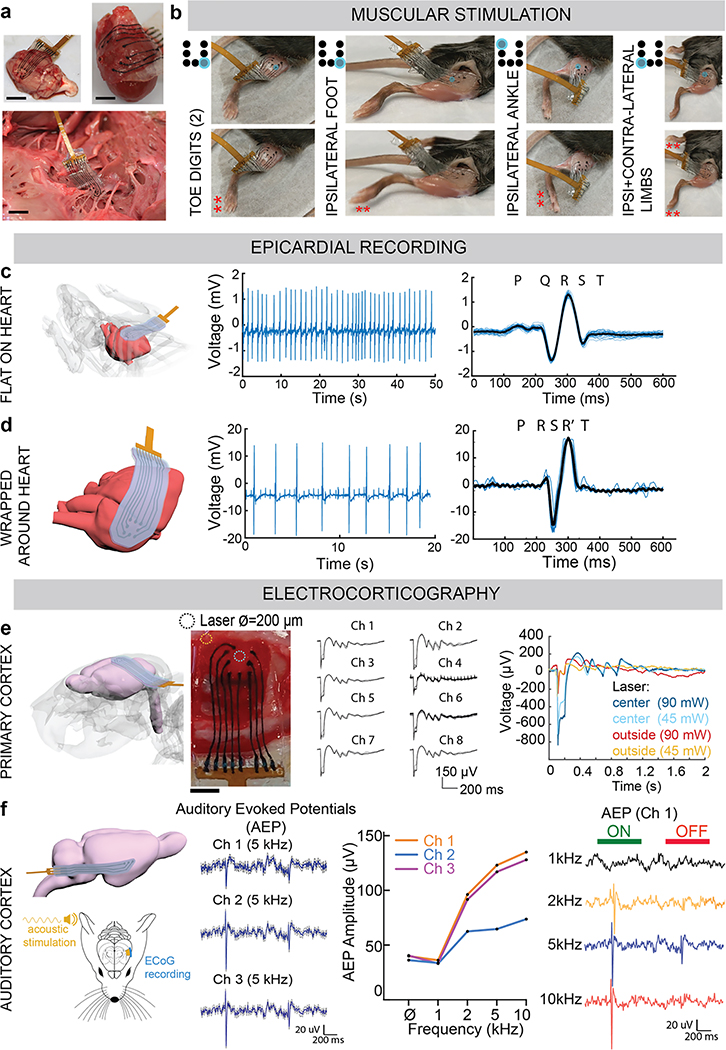
Figure 6: In vivo validation of the fully viscoelastic device for stimulation and for recording, even under extreme deformation.
(a) Photographs of the assembled viscoelastic array on a rat cortical surface (top, left), conformed around a rat heart (top, right), and wrapped around the nerves of a bovine heart (bottom). Scale bar: 3 mm.
(b) Photographs, taken from videos, of the viscoelastic array stimulating the exposed muscle of a mouse hindlimb. By positioning the array or changing the electrode applying the stimulation pulses, the toes only (far left), the foot only (left), the ankle (right), or both the contralateral and ipsilateral limbs (far right) are triggered. Red asterisks (**) mark the portion of the limb responding to stimulation. Schematic to the left of each image shows the representative electrode (blue) that is stimulating the tissue.
(c) Schematic of the viscoelastic array, flat and conformed to the surface of a mouse heart (left). Acute electrical activity recorded in vivo from the mouse heart with three electrodes, with the filtered electrocardiogram (EKG) (middle), and superimposed average (black) of all the beats (right). Individual cycles are shown in light blue.
(d) Schematic of the viscoelastic array, wrapped almost 360° around the surface of a mouse heart (left), and remaining conformed. Acute electrical activity recorded in vivo from the mouse heart with three electrodes, with the filtered electrocardiogram (EKG) (middle), and superimposed average (black) of all the beats (right). Individual cycles are shown in light blue.
(e) Schematic of the viscoelastic array, placed on the cortical surface of a rat brain (far left). Photograph of the viscoelastic array on top of the exposed dura of a Thy1 rat cortex (left, scale bar: 4 mm), with added circles to show where stimulation from a laser was applied (either at the blue circle: centre of device, or brown circle: lateral edge of device). Acute electrical activity recorded in vivo, epidurally from the cortical surface after stimulation by blue light laser, at centre or lateral edge of array. Each electrode depolarization is shown by each respective electrode tracing, as the average and standard deviation over the recording session (top, right). Comparison of the electrical activity recorded by a single channel (Ch) as the laser position changed from the centre of the device (blue curves) to the lateral edge, and as the laser power changed from 90 mW (dark blue and brown traces) to 45 mW (light blue and brown traces).
(f) Schematic of the viscoelastic array, bent more than 90° to reach the auditory cortex of a rat brain (top, left). Schematic of the set-up for recording from the auditory cortex (bottom, left). Acute electrical activity recorded in vivo, epidurally from the auditory cortical surface from each of the 3 electrodes (channels) of the array, when an acoustic tone of 5 kHz was applied. In addition to recording auditory evoked potentials (AEP) from each Ch, an independent frequency tuning profile of each Ch was obtained. Tone burst stimulation (duration of 1 second) applied, and AEP recorded from Ch 1, over 4 applied acoustic tones (1, 2, 5, 10 kHz). ‘ON’ (green) and ‘OFF’ (red) of the tone burst are indicated above AEP.

