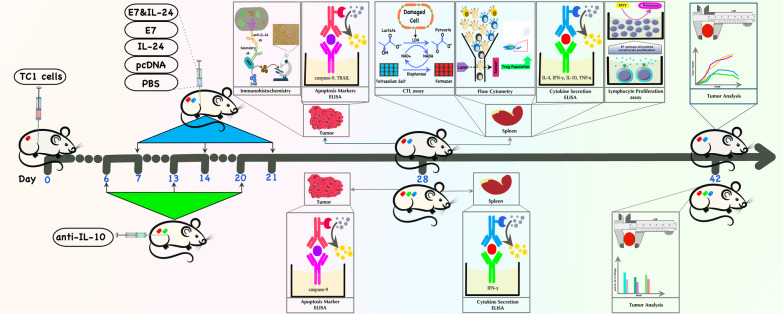
Fig. 1.
Schematic overview of all analyses from day 0 to day 42. Briefly, 1 week following tumor challenge (day 0), mice were immunized with E7, IL-24, or E7&IL-24; or received control reagents (pcDNA or PBS). This procedure was repeated 2 times at one-week interval. One week later (day 28), experiments were conducted regarding lymphocyte proliferation, cytokine secretion (using ELISA), CTL responses, caspase-9 and TRAIL levels (using ELISA), Treg population (using flow cytometry) and anti-IL-24 immunohistochemistry. Finally, on day 42, the last tumor analysis was performed (following every 2 day monitoring routine from day 14), and data interpretation was applied. In parallel (as depicted under the timeline), a group of mice received anti-IL-10 one day before each immunization. On day 28, the level of IFN-γ, as well as caspase-9, was measured. On day 42, the final tumor data were obtained and compared with the results of isotype control groups. Description of label colors on mice bodies: red = tumor-bearing mouse; blue = immunized mouse; green = anti-IL-10-received mouse

